
Investors See Largest Ever Decline in Fund Fees
We give an in-depth look at our annual fund fee study.
/s3.amazonaws.com/arc-authors/morningstar/de44b91c-c918-4e53-81c3-ce84542f3d36.jpg)
Investors paid lower fund expenses in 2017 than ever before. Our study of U.S. open-end mutual funds and exchange-traded funds found the asset-weighted average expense ratio across funds was 0.52% in 2017, an 8% decline from 2016. This is the largest year-over-year decline we have recorded since we began tracking the trend in asset-weighted average fees in 2000. Consequently, we estimate that investors saved roughly $4 billion in fund expenses last year (see Appendix for details). This fee decline is a big positive for investors because fees compound over time and diminish returns.
Exhibit 1 Asset-Weighted Average Fees for Funds Decline 8% in 2017
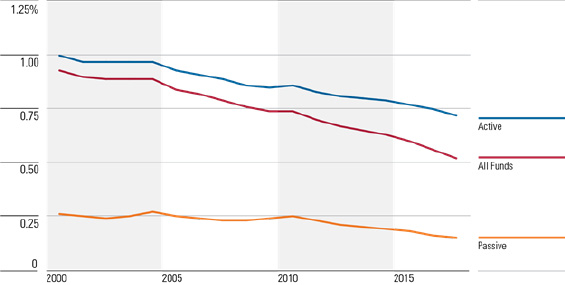
Source: Morningstar. Data as of 12/31/17.
In this study, we examine the trend in mutual fund expenses paid by investors using the asset-weighted average expense ratio as our measure. The asset-weighted average is a better measure of the average cost borne by fund investors, rather than an equal-weighted average. For example, for U.S. equity funds, the asset-weighted average expense ratio was 0.45% versus the equal-weighted average expense ratio of 1.10%. Funds with expense ratios above 1.10% accounted for less than 10% of assets invested in U.S. equity funds in 2017, so the simple average does not reflect most investors’ experiences.
The main asset classes, U.S. equity, taxable-bond, and international equity, exhibited the largest annual decline in asset-weighted average expense ratios. (Allocation funds are underrepresented in this study, as most employ a fund-of-funds structure. We omitted funds of funds as their underlying funds’ fees are already represented in the study.) U.S. equity funds (which account for 42% of invested assets in mutual funds and ETFs) saw asset-weighted average fees decline 9% to 0.45% in 2017. Taxable-bond funds (21%) saw asset-weighted average fees decline 7% to 0.44%, and international equity funds declined 8% to 0.64%. These averages include active and passive funds in aggregate.
Declines in the asset-weighted average fees were more pronounced among passively managed funds thanks to strong flows into the lowest-cost funds, as well as fee cuts by some asset managers for widely held broad index funds. In aggregate, passively managed funds exhibited asset-weighted expense ratio declines of 7% from 2016. International equity funds exhibited the largest declines among passive funds, whose asset-weighted average fees fell 9% to reach 0.23%.
Declines in asset-weighted average fees on the active side were driven primarily by large net flows out of expensive funds, and large net flows into cheaper funds. Also in 2017, there was an increase in the percentage of active funds exhibiting lower fees. As a result, in aggregate, asset-weighted fees for actively managed funds declined 4% in 2017 from the year prior, the largest annual decrease in over a decade.
Exhibit 2 Investors' Average Fund Costs as Represented by Asset-Weighted Average Fees
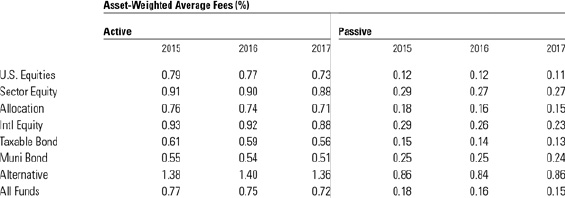
Source: Morningstar. Data as of 12/31/17.
(
)
Exhibit 3 Fees Paid for Passive Funds Exhibit Larger Declines Than Fees Paid for Active Funds
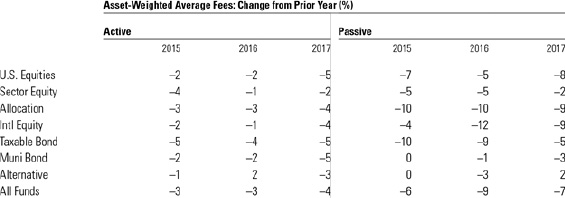
Source: Morningstar. Data as of 12/31/17.
(
)
Trends in Fund Fees Charged by the Industry Investors' move to lower-cost active and passive funds has been a key driver of falling costs. In 2017, fee reductions by the asset-management industry for active funds had a larger impact on investors' falling fund expenses, relative to recent years.
Changes in fees charged by asset managers can be represented by trends in the equal-weighted average expense ratio. Below, we calculated the equal-weighted average expense ratio for active and passive funds, by asset class. We used an equal-weighted average here, as opposed to an asset-weighted average, to reflect what the asset-management industry is charging for its products, regardless of the fund’s size. The calculations below represent 90% of all assets (the 5,000 largest share classes). We culled the universe to avoid skewing the overall figures toward funds with low asset levels and high fees.
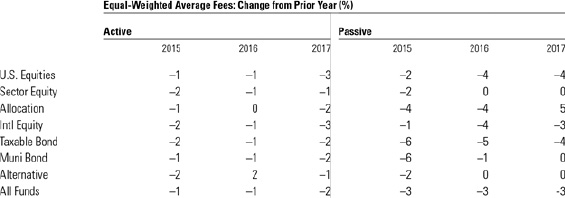
Exhibit 4 Fund Fees Charged by Asset Managers as Represented by Equal-Weighted Average Fees
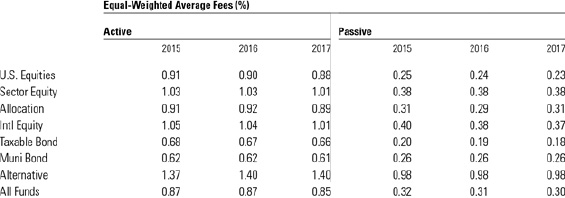
Source: Morningstar. Data as of 12/31/17.
(
)
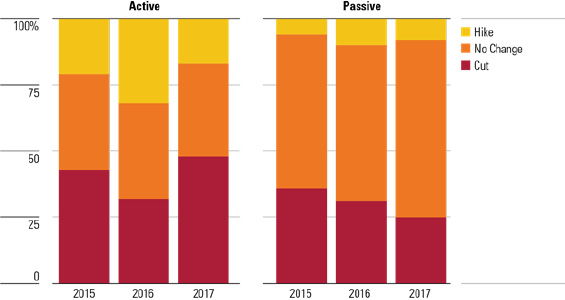
Exhibit 5 Among Active Funds, Larger Fee Declines in 2017 Relative To Prior Years
Source: Morningstar. Data as of 12/31/17.
(
)
Over the past three years, passive funds (across the three main asset classes) have exhibited steeper declines in equal-weighted fees, relative to actively managed funds. Vanguard, which levies its fees at cost, has set a low bar for fees for broad index funds, and in recent years, BlackRock/iShares, Schwab, and Fidelity have aggressively cut fees for core broad index funds. Some asset managers now charge only a few basis points for core index funds. This has resulted in larger declines in average fees for passively managed U.S. equity and taxable-bond funds, which account for 64% of assets in mutual funds and ETFs. In 2016 and 2017, funds from these two asset classes exhibited the largest annual fee declines, of 4% to 5%.
On the active side, the percentage of funds exhibiting lower fees rose in 2017 relative to 2016. At the same time, fewer funds exhibited higher fees. However, the percentages of active funds exhibiting higher or lower fees from year to year is not consistent, as opposed to passive funds, which tend to not raise fees. One reason for this that passive funds have enjoyed consistent inflows, across asset classes, over the past 18 years. Active funds as a group have experienced more erratic flows, but most notably, actively managed U.S. equity funds have experienced continuous outflows since 2006. Changes to funds’ asset levels can trigger breakpoints that raise and lower fund fees.
In 2017, the increase in active funds exhibiting lower fees was observed primarily in U.S. equity and international equity funds. International equity funds exhibited the largest percentage drop in equal-weighted fees of just over 3%. U.S. equity funds followed, with declines of just under 3%. Most of these declines reflected strong equity-market performance that raised asset levels and triggered fee breakpoints. Particularly for active U.S. equity funds, market appreciation more than offset the 5% in outflows in 2017.
Exhibit 6 Passive Funds Are Less Likely to Raise Fees Relative to Active Funds
Source: Morningstar. Data as of 12/31/17.
Asset Flows Favor Lower-Cost Passive and Active Funds Morningstar research has demonstrated that mutual fund costs are a reliable predictor of future returns, as low-cost mutual funds generally outperform their more-expensive peers.
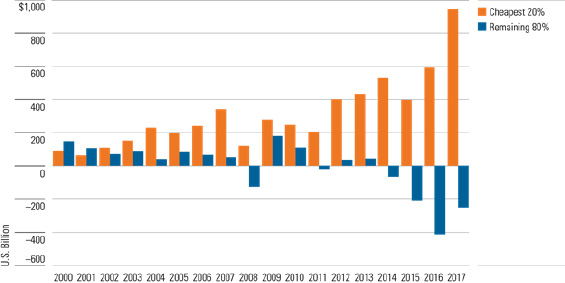
Since 2000, net flows into funds with a Morningstar Fee Level — Broad rank of Low (fees ranked in the bottom quintile, or 20%, among funds within their category group; see Appendix for additional details) continue to trend higher. In 2017, these Low-fee-ranked funds saw net inflows of $949 billion, the highest ever, and a 60% increase over 2016 levels. In 2017, passively managed funds accounted for 70% of the net flows into Low-fee-ranked funds, while actively managed funds accounted for the remaining 30%.
Flows out of funds with Below Average, Average, Above Average, and High ranked fees (the remaining 80%) have been ongoing since 2014 and reached $251 billion in 2017, a decline from 2016’s $414 billion, but higher than 2014 and 2015 levels of $66 billion and $212 billion, respectively.
Exhibit 7 The Shift into Low Fee-Ranked Funds Accelerates
Source: Morningstar. Data as of 12/31/17.
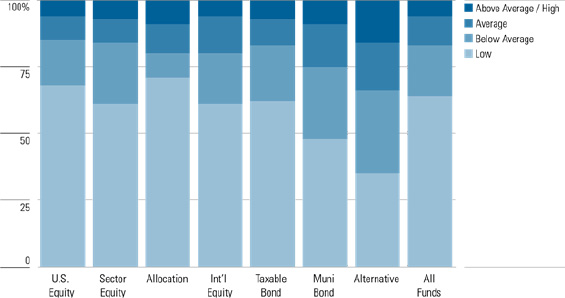
Because of these trends, most investors are in lower-priced funds. Currently, 83% of all assets are in open-end mutual funds and ETFs that have a Low or Below Average Morningstar Fee Level — Broad rank (fees within the bottom two quintiles), 11% are in funds with an Average rank, and 6% are in funds with an Above Average or High rank.
Exhibit 8 Most Investors Are in Funds with Low or Below-Average Fees
Source: Morningstar. Data as of 12/31/17.
The full paper can be accessed here.
/cloudfront-us-east-1.images.arcpublishing.com/morningstar/HDPMMDGUA5CUHI254MRUHYEFWU.png)
/cloudfront-us-east-1.images.arcpublishing.com/morningstar/OMVK3XQEVFDRHGPHSQPIBDENQE.jpg)
:quality(80)/s3.amazonaws.com/arc-authors/morningstar/de44b91c-c918-4e53-81c3-ce84542f3d36.jpg)