
Don't Try to Time Active and Passive Equity Exposure
Stylistic differences between active and passive managers contribute to the variation in active managers’ performance, but they don’t tell the whole story.
/s3.amazonaws.com/arc-authors/morningstar/64dafa24-41b3-4a5e-aade-5d471358063f.jpg)
Earlier this year, our team put Dunn's Law to the test to determine whether stylistic differences between active and passive managers could help explain the variation of active fund managers' success rates from Morningstar's Active/Passive Barometer. Dunn's Law predicts an inverse relationship between active managers' index-relative performance and the performance of their investment style. That's because active managers tend to be less style-pure than the indexes against which they are benchmarked. So, they should benefit when adjacent categories do better than their own and do worse when their Morningstar Category enjoys strong relative performance.
In this article, I test how well predictions from Dunn’s Law stack up when using asset-weighted return differences between active and passive funds to measure manager success rather than success rates. Success rates represent the percentage of funds in a Morningstar category that survive and outperform the equally weighted average passive fund return over a specified period. In this case, success is a binary measure, and gives all funds equal weighting, regardless of assets under management.
How to Measure Success? The benefit of using success rate as the measure of success is that it accurately reflects investors' odds of choosing a winning fund from the starting universe. All funds available at the start of the measurement period are given equal footing, and funds that are liquidated during the measurement period count as unsuccessful to account for survivorship bias. That is, it represents all funds available to an investor when they make their decision and penalizes those that close during the measurement period because that tends to be associated with poor performance and a bad investor experience. The drawback of this measure is that it doesn't capture the magnitude of out- or underperformance. A fund earns a successful classification whether it outperforms the equally weighted index funds in its category by 0.1% or 10%.
In this article, I’ll use the asset-weighted return difference between actively managed funds and index-tracking funds as the dependent variable in the regression to test Dunn’s Law. Asset-weighted returns capture the magnitude of under- or outperformance and weight these returns by assets invested, so this metric likely better represents how the average investor dollar fared during the measurement period. If a fund with a lot of assets posts returns that trounce its asset-weighted index benchmark, then more investor dollars did well compared with the asset-weighted index dollar. But using asset-weighted returns doesn’t jibe with an event study methodology. Asset-weighted average returns include funds that existed in each month, but not funds that survive the full measurement period.
Another interesting wrinkle is that asset-weighted returns are usually higher than equal-weighted returns for both actively managed and index-tracking funds. This is likely because investors have chosen better and cheaper funds and allocated more dollars to them. Although both metrics seek to quantify how successful active managers have been, their relationship is not as strong as I had expected it to be. Exhibit 1 below shows a scatterplot of the quarterly rolling five-year success rates and asset-weighted return differences for the nine U.S. equity Morningstar Style Box categories from September 2002 through December 2017.
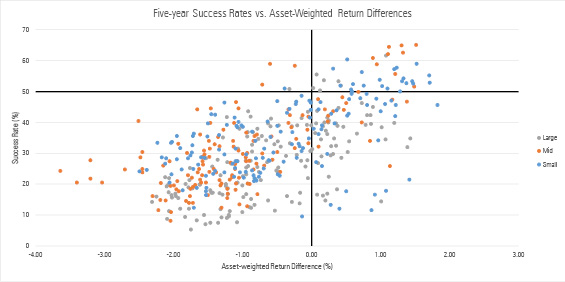
Source: Analysts' calculations; Morningstar Active/Passive Barometer; Morningstar Direct. Quarterly data (where available) from September 2002 through December 2017
The correlation between both measures is only about 0.6. It seems that achieving positive asset-weighted returns is more common than posting a success rate of greater than 50% in a Morningstar Category. There are 478 observations in Exhibit 1. Of those, 41 observations (8.6% of all observations) represent success rates greater than 50%, and 132 observations (27.6%) achieved positive asset-weighted return differences. Only 36 observations (7.5%) achieved both greater than 50% success rates and positive asset-weighted return differences.
Success Rates versus Asset-Weighted Return Differences Despite the differences between these two measures of success, the predictions from Dunn's Law using asset-weighted return differences compared with success rate largely line up. As a refresher, we built a regression model to explain the variation in active managers' success rates within each category over time. For the nine U.S. equity categories, the explanatory variables in the model included the returns to market risk, small size, value, and international stocks relative to U.S. stocks. We calculated each of these explanatory variables (or factors) using an index return spread.
The regression analysis measures how closely the variation in active managers’ success rates is linked to the payoff of potential style differences between active and index managers. For example, if active managers in the large-value Morningstar Category have greater exposure to mid-cap value stocks than their index peers, their success rates should improve when smaller stocks beat larger stocks. The regression would detect that relationship.
While this model should pick up variations in success rates that arise from differences in exposure to small size, value, market risk, and international stocks, it doesn’t capture other ways in which active funds differ from their index peers. These include differences in stock selection and sector exposure unrelated to these factors, which may limit its explanatory power.
I used this same model in attempt to explain the variations in asset-weighted return differences between actively and passively managed funds. Exhibit 2 below shows the three- and five-year measurement periods for the nine U.S. equity Morningstar Categories.
Exhibit 2: Regression Results from Success Rates and Asset-Weighted Return Differences
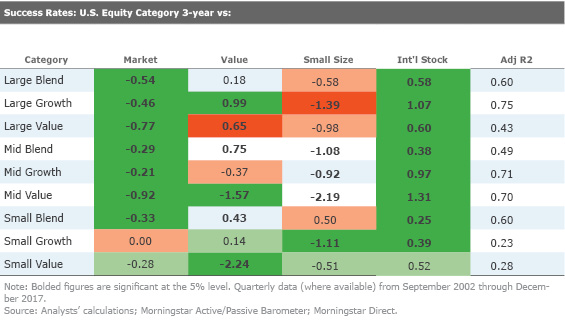
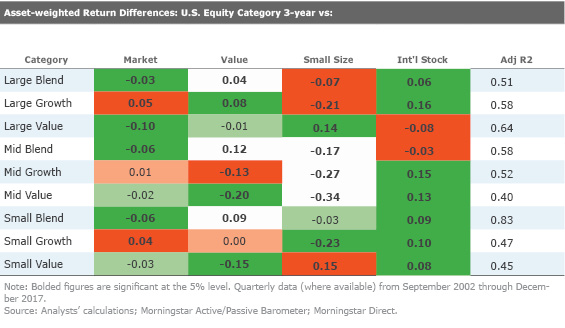
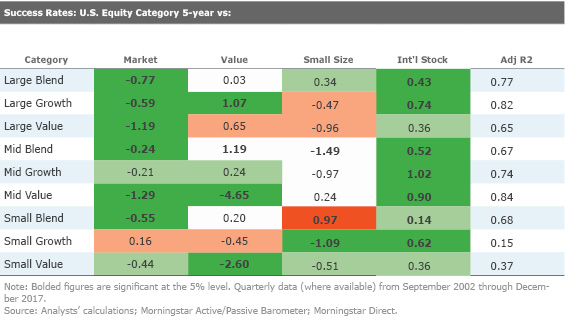
The results largely line up with the original analysis, but there are a few differences. In the original study, the two most consistent indicators of success rates—market returns and international stock exposure—have less consistent explanatory power across categories when attempting to explain the variation of asset-weighted return differences. For example, we expect active U.S. equity funds to outperform their index peers when international stocks perform better than U.S. stocks because the average active fund likely has more exposure to non-U.S. stocks than U.S. index funds. This relationship held across all nine categories in the original study but didn’t hold for large-value or mid-blend when using asset-weighted returns.
In the original study, the U.S. market return had a negative relationship with the success rates in every category except for small-growth. In this updated study, the relationship doesn’t hold for large-, mid-, and small-growth or small value. On the other hand, the adjusted R-squared values of the model were more stable across Morningstar Categories for the asset-weighted return differences than the success rates.
When to Invest in Passive or Active Funds? It's difficult to fully explain why the average active fund in a given category outperforms its passively managed peers for a given measurement period. Stylistic differences between active and passive managers contribute to the variation in active managers' performance, but they don't tell the whole story and the results don't always line up with the predictions of Dunn's Law. The average of any large sample is noisy and it's hard to distill success into one data point for an entire category.
The most important takeaway is that it’s not advisable to attempt to time exposure between index and active managers because this is like timing just about anything else in the market—it’s hard to do successfully. Instead, investors should focus on the aspects of investing that they can control, such as:
- Set an appropriate asset allocation.
- Don't overpay for investment management.
- Don't place too much weight on short-term performance.

Disclosure: Morningstar, Inc. licenses indexes to financial institutions as the tracking indexes for investable products, such as exchange-traded funds, sponsored by the financial institution. The license fee for such use is paid by the sponsoring financial institution based mainly on the total assets of the investable product. Please click here for a list of investable products that track or have tracked a Morningstar index. Neither Morningstar, Inc. nor its investment management division markets, sells, or makes any representations regarding the advisability of investing in any investable product that tracks a Morningstar index.
:quality(80)/cloudfront-us-east-1.images.arcpublishing.com/morningstar/T2LGZCEHBZBJJPPKHO7Y4EEKSM.png)
:quality(80)/cloudfront-us-east-1.images.arcpublishing.com/morningstar/HDPMMDGUA5CUHI254MRUHYEFWU.png)