
Analyzing the Performance of Our Stock Recommendations
We assess the Morningstar rating for stocks through three lenses.
/s3.amazonaws.com/arc-authors/morningstar/89083f4d-2734-498d-bceb-7be9b9410e38.jpg)
Morningstar's equity analysts have been providing investment recommendations (the stock star rating) since 2001, but how has the Morningstar Rating for stocks performed? And what is the typical experience investors had on a typical day when investing according to our ratings?
We recently published a study assessing the performance of our ratings through three lenses: a cross-sectional regression, an event study, and a portfolio approach. In summary, we find strong evidence using a statistical model that controls for the factors of market, size, value, and momentum effects (Fama-MacBeth cross-sectional regression) that Morningstar’s equity star ratings have been predictive of future stock returns. Our updated event study and equal-weighted portfolios approaches provided mixed evidence to support the claim that star ratings are predictive of future stock returns.
Isolating Morningstar's Contribution The Fama-MacBeth cross-sectional regression procedure, which controls for four of the more well-known dimensions of returns to better isolate the contribution from Morningstar's ratings on performance beyond these factors, shows a monotonic relationship with the star rating, with increases in star rating directly leading to increases in realized monthly return. Most noticeable are the statistically significant 5-star and 1-star rating premiums.
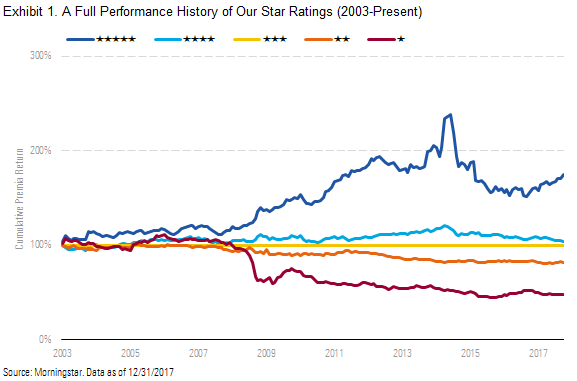
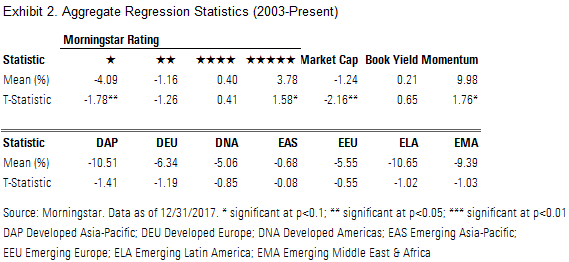
Exhibits 1 and 2 illustrate the results of this regression procedure, in which we controlled for market, size, value, and momentum effects to better isolate the contribution from Morningstar’s ratings on performance beyond these factors.
This analysis of Morningstar’s rating for stocks demonstrates that Morningstar’s star ratings have statistically significant explanatory power for the future performance of stocks. Exhibit 2 shows a monotonic relationship with the star rating, with increases in star rating level directly leading to increases in realized monthly return. Most noticeable are the statistically significant 5-star (at the level of p<0.1) and 1-star (at the level of p<0.05) rating premiums.
Refining Our Event Study Approach While the Fama-MacBeth approach represents a highly rigorous evaluation of the efficacy of our ratings, it may not be the most intuitive or represent the actual experience of investors.
In our first paper evaluating the efficacy of our ratings in December 2016, we presented an event study technique that showcased the typical experience investors had when investing according to the levels in the Morningstar Rating for stocks. This approach answered the question of what the typical return for a 5-star stock versus a 1-star stock over various time horizons from one month to five years was. We believed that this was a very reasonable question with a very intuitive answer.
However, while these numbers are accurate and the approach reasonable, they may present a rosier picture of our ratings than we intended. We have now updated our event study methodology to present what we believe will be a more accurate assessment of our ratings’ efficacy. Specifically, the new event study showcases the typical experience investors had on a typical day when investing according to the levels in the Morningstar Rating for stocks. Adding the dimension of time to our analysis is important because we want investors to be able to derive value from our stock calls on most days rather than seeing the value cluster on some specific day here or there.
While the data and calculations of the original event study are correct, the aggregate results are influenced heavily by the distribution of our star ratings over time. (In some periods, we have hundreds of 5-star stocks; in others, only a handful.)
To elaborate, the aggregate 5-star performance is driven by the hundreds of calls we made during the financial crisis. However, even during this period, our 5-star recommendations may not have outperformed our 1-star recommendations. Because of the way we were aggregating the results, it would be possible to have 1-star calls outperform in most periods and still have the aggregate results look favorable.
To correct for the limitations of the previous event study, we have introduced a benchmark approach. We have chosen to compare the median star-rating outcome with the median outcome of our covered universe, which reflects the everyday experience and opportunities of investors using our ratings. Measuring against a benchmark helps neutralize the impact of measuring and comparing absolute returns over different market conditions.
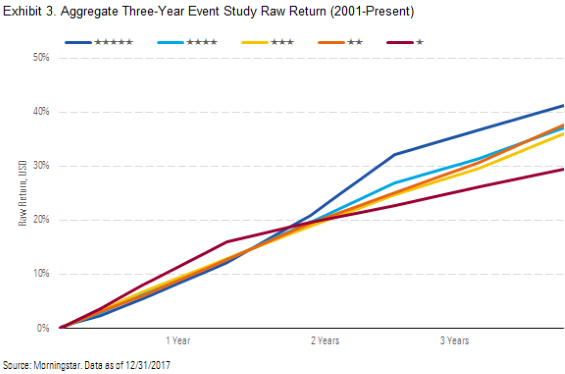
For the sake of consistency, we still briefly present in Exhibit 3 up-to-date results using the prior event study methodology. The previous event study methodology analyzes the average total return of the star ratings we issue. We measured the total return of each stock from every day that a star rating was assigned for the subsequent three-year period. Exhibit 3 shows that since June 2001, our 5-star calls have delivered an average three-year annualized total return of 12.2%, and our 1-star stock calls have delivered a three-year annualized total return of 9.0%. These results signify that the average stock call we made added value to investors.
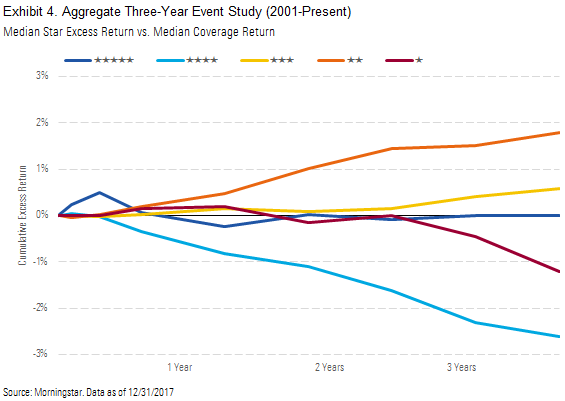
The benchmark event study approach shows less definitive results than the average raw return approach. Exhibit 4 illustrates that our 5-star stock calls have delivered a median three-year excess total return of 0.0% and our 1-star calls have delivered an excess return of negative 1.2%. Meanwhile, our 4-star calls have delivered a median three-year excess total return of negative 2.6%, our 3-star calls 0.6%, and our 2-star calls 1.8%. While our overall results do not present a favorable picture of the predictive ability of our star ratings using the updated event study approach, we’ll illustrate some of the drivers behind that performance later in this article.
As shown in Exhibit 4, our 5-star stock calls have delivered a median three-year excess total return of 0.0% and our 1-star calls have delivered an excess return of negative 1.2%. Meanwhile, our 4-star calls have delivered a median three-year excess total return of negative 2.6%, our 3-star calls 0.6%, and our 2-star calls 1.8%.
A Portfolio Approach Our supplemental approach to testing the efficacy of the star ratings constructs equal-weighted portfolios based on a stock's star rating at the beginning of each month. Exhibit 5 illustrates that unlike the regressions, the monthly reconstructed portfolio results are less definitive. The 5-star cohort generated superior returns through much of our history, but because of concentrated recommendations in the energy and basic materials sectors, the 5-star cohort gave back much of the outperformance it had generated.
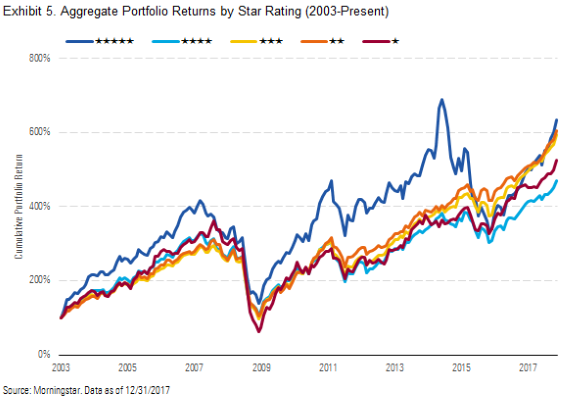
Energy and Basic Materials Calls Weigh on Results Concentrated 5-star calls in energy and basic materials in 2014 and 2015 challenged our overall results. While we recognized the improvement in oil and natural gas shale drilling and the re-emergence of the United States as a major energy producer, we underestimated the magnitude of the positive contribution that U.S. shale production would have with respect to supply dynamics (and, by extension, the negative impact on commodity prices).
Our overly optimistic oil and gas price assumptions explicitly affected our valuation work and led to a high number of 5-star calls that have not worked out. Further, cheaper gas encouraged more coal-to-gas switching among U.S. utilities, resulting in coal prices that are likely to remain lower than we had originally anticipated and leading to especially poor performance of the basic materials sector’s coal company calls. We also had several 5-star calls on gold miners in the basic materials sector in 2014 and 2015 that weighed on performance as gold prices fell from $1,225 per ounce to $1,060 per ounce.
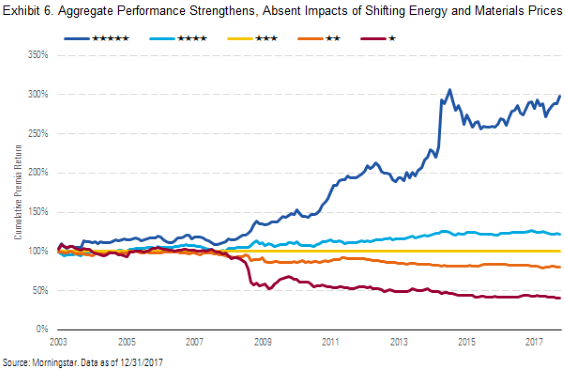
Exhibit 6 shows the cumulative returns of $1 invested in the star rating premiums series over time after excluding the results from the energy and basic materials sectors, highlighting the strong outperformance of the 5-star cohort and substantial underperformance of the 1-star cohort.
After excluding our energy and basic materials coverage, our 5-star stock calls have delivered a median three-year excess total return of 0.3% and our 1-star calls have delivered an excess return of negative 6.5%. Meanwhile, our 4-star calls have delivered a median three-year excess total return of 0.6%, our 3-star calls 1.5%, and our 2-star calls 2.7%.
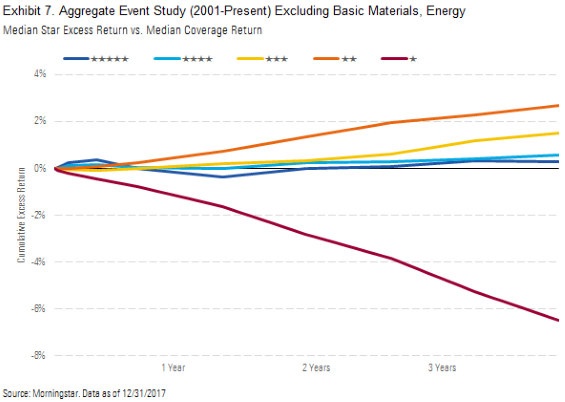
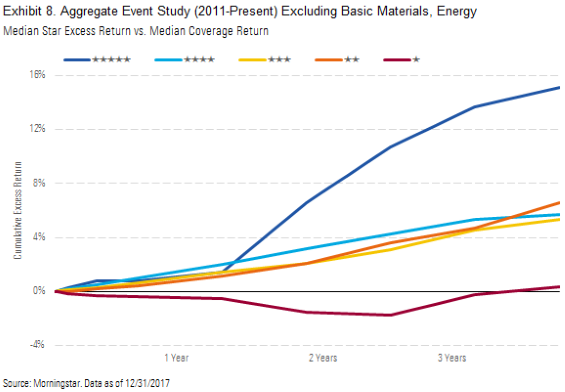
Exhibit 8 illustrates that after excluding our energy and basic materials coverage and looking at our more recent results since 2011, our 5-star stock calls have delivered a median three-year excess total return 14.7 percentage points greater than the median excess total return of 1-star calls.
In summary, we find strong evidence using a Fama-MacBeth cross-sectional regression procedure that Morningstar’s equity star ratings have been predictive of future stock returns after controlling for the factors of market, size, value, and momentum effects. Our updated event study and equal-weighted portfolios approaches provided mixed evidence to support the claim that star ratings are predictive of future stock returns.
©2018 Morningstar. All Rights Reserved. The analysts identified in this paper are employed by Morningstar Research Services LLC, a wholly owned subsidiary of Morningstar, Inc. Morningstar Ratings for Stocks are forward-looking assessments and include assumptions of future events, which may or may not occur or may differ (in some cases significantly) from what was assumed. Morningstar Ratings for Stocks are statements of opinions, subject to change, are not guarantees, and should not be used as the sole basis for investment decisions. The views expressed and the conclusions drawn within are given in good faith, are as of the date of this paper, are not statements of fact, and are subject to change. The information, data, analyses, and opinions presented herein do not constitute investment advice; are provided solely for informational purposes and therefore are not an offer to buy or sell a security; and are not warranted to be correct, complete, or accurate. Except as otherwise required by law, Morningstar shall not be responsible for any trading decisions, damages, or other losses resulting from, or related to, the information, data, analyses, or opinions or their use. The information contained herein is the proprietary property of Morningstar and may not be reproduced, in whole or in part, or used in any manner, without the prior written consent of Morningstar.
:quality(80)/cloudfront-us-east-1.images.arcpublishing.com/morningstar/R7HDJUUCAVCXZH56GSOH6M55CU.jpg)
:quality(80)/cloudfront-us-east-1.images.arcpublishing.com/morningstar/347BSP2KJNBCLKVD7DGXSFLDLU.jpg)
:quality(80)/cloudfront-us-east-1.images.arcpublishing.com/morningstar/Y5GCIVFOLREPXPM42MPMPEEMDI.jpg)