
A Tale of Two High-Dividend-Yield ETFs
A good process helps mitigate risk.
/s3.amazonaws.com/arc-authors/morningstar/78665e5a-2da4-4dff-bdfd-3d8248d5ae4d.jpg)
A version of this article appeared in the February 2018 issue of Morningstar ETFInvestor.
Funds that focus on dividend yield may look appealing to those seeking a consistent, stable source of income. Done well, they can deliver on this objective, but a shoddy process can expose investors to large amounts of risk and lead to poor long-term outcomes. Comparing a good high-yield-oriented dividend fund to one with less favorable characteristics should help illustrate some of the nuances that can make or break these strategies.
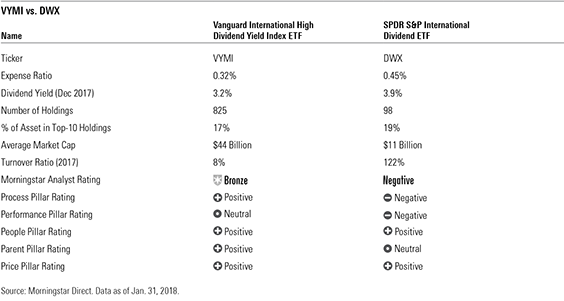
Here, I'll discuss the nature of the indexes that underpin these funds and their inherent risks. I'll then unpack the details of the indexes behind two foreign high-yield exchange-traded funds:
The Traits of High-Yielding Stocks Funds that focus on dividend yield can harbor risk. Stocks with high dividend yields achieve their status from price declines, a consequence of poor prospects, declining fundamentals, or some combination of the two. Thus, this group tends to be riskier and more volatile than the broader market. As a result, funds that focus on high-yielding stocks tend to have a value orientation. This isn't necessarily bad, but a good high-dividend yield strategy should take reasonable measures to mitigate the risks that these companies bring to the table.
Same Objective but Different Roads Traveled DWX and VYMI both start their stock-selection process with a similar universe. VYMI begins with the large- and mid-cap-focused FTSE All-World ex US Index, while DWX selects from the S&P Global ex-US Broad Market Index, which includes small-cap names. While DWX has not had consistent exposure to small caps, its average market capitalization has historically run much lower than VYMI and its foreign large-value Morningstar Category peers. This can be a consequence of small-cap inclusion but is also heavily influenced by the way DWX weights its holdings (covered below). In either case, tilting toward smaller stocks can cause DWX to be more volatile than VYMI.
Sector concentration also poses a potential risk to this type of fund. Real estate investment trusts typically offer higher yields than stocks from other sectors, making these funds prone to overweight them. But both methods take measures to control their exposure to REITs. DWX limits its allocation to all trusts, including REITs, to 10% of assets, while VYMI completely eliminates REITs from its selection universe.
After paring down their initial universe, both of these funds' benchmarks screen and rank potential holdings before making their final selections. DWX uses sustainability filters to improve its odds of holding companies that will continue paying dividends in the future. It looks for those with positive dividend growth during the prior three years, and sufficient earnings to cover dividend payments. VYMI takes a more direct approach and simply eliminates all companies not expected to pay regular dividends in the next 12 months. These methods are slightly different, but neither provides a substantial advantage in selecting stocks of superior quality. Both are low hurdles that essentially eliminate the dodgiest stocks from being included in the final portfolios.
Stocks that pass these screens are then sorted by yield to identify the highest-yielding names. VYMI ranks stocks by their expected dividend yield using forward-looking estimates from I/B/E/S, while DWX orders stocks by their risk-adjusted yield (trailing 12-month yield divided by trailing 36-month dividend-yield volatility). The differences between these two approaches is minor. The important point is that both funds identify the highest-yielding stocks prior to final selection and weighting.
Up to this point, both of these funds' index methodologies have charted similar courses. They select from a broad pool of stocks, screen for those that are likely to continue making dividend payments, and rank potential holdings using some measure of yield. But the selection and weighting criteria are where they distinguish themselves.
VYMI's index adds stocks starting with those that have the highest expected yield. It continues adding names until it captures 50% of the market cap of its beginning universe. This results in a broad collection of more than 800 stocks. By comparison, DWX sweeps only the 100 highest-ranking stocks into its portfolio and puts a 3% cap on individual names to promote diversification.
On the surface, both funds look like they reasonably diversify stock-specific risk. Each has less than 20% of its assets allocated to its 10 largest holdings. But VYMI actually has the advantage. Diversifying more broadly creates an effective shield against poor-performing stocks: Its large number of holdings helps mitigate the impact that any one stock can have on the fund's performance. By contrast, bad stock selection will hurt DWX much more, simply because it holds far fewer stocks.
The second, and perhaps most notable difference, is how these two funds' benchmarks weight their constituents. VYMI's bogy weights its holdings by market cap, which naturally emphasizes large, stable companies while underweighting those that are smaller and more volatile. This approach also incorporates a stock's price into the equation, which may be a better predictor of future performance as it--in theory--reflects all known information. Market-cap weighting also has the added benefit of mitigating turnover, since a stock's weighting will float with price changes.
On the other hand, DWX ignores stock prices, instead weighting its holdings by their trailing 12-month yield. This emphasizes the highest-yielding stocks, but those with the highest yields tend to be the riskiest and most troubled. This approach also ignores price, meaning DWX can overweight stocks with negative momentum, an indicator of expected underperformance. This scenario played out in early 2015, when a number of energy stocks declined in price following a collapse in the price of oil. Their yields consequently increased, and DWX piled into many of these names, overweighting the energy sector by 10% compared with the foreign large-value category average. But the price of these stocks continued to fall, hurting the fund's performance.
Assessing the Cost of Ownership Expense ratios constitute the first layer of fees that investors pay for these funds. VYMI (0.32% expense ratio) has a clear advantage over DWX (0.45% expense ratio), because it charges 0.13% less on an annual basis. A second implicit layer of expenses stems from these funds' trading activity, proxied by their turnover ratios. Funds with high turnover must buy and sell stocks more often, resulting in greater transaction costs (trading commissions, bid-ask spreads, and so on). As mentioned previously, the difference in how these funds weight their holdings drives differences in turnover. VYMI weights its constituents by market cap, so a stock's weighting will float proportionally to changes in its price, resulting in low turnover. However, DWX breaks the link between a stock's weighting and its price, weighting constituents by their dividend yield. In doing so, it will perform more trades, buying more of those that have declined in price relative to dividends paid while selling those that have done the opposite, resulting in more costly execution. As a result, DWX's median annual turnover was 76% in the five years through December 2017. VYMI has shorter track record, but its turnover ratio ran at less than 10% in both 2016 and 2017.
The End Result Both of these approaches result in portfolios of stocks with high dividend yields. As of this writing, both have a dividend yield that is greater than 70% of their peers in the foreign large-value category. While VYMI has a lower trailing 12-month yield, its approach forfeits some yield in favor of better risk management. Its market-cap-weighted approach emphasizes large dividend-paying stocks. The fund's portfolio also boasts a lower average dividend payout ratio (dividends divided by earnings), indicating that its constituent stocks are more likely to continue paying dividends in the future. The combination of large, stable companies and a market-cap-weighted approach promotes lower turnover and reduces the associated transaction costs. Furthermore, VYMI also features a lower expense ratio, which should provide investors with a sustainable long-term advantage versus category peers. Between these two funds, VYMI clearly stands out as the superior choice. It earns a Morningstar Analyst Rating of Bronze, while DWX has been assigned a Negative rating.
/d10o6nnig0wrdw.cloudfront.net/04-18-2024/t_34ccafe52c7c46979f1073e515ef92d4_name_file_960x540_1600_v4_.jpg)
/d10o6nnig0wrdw.cloudfront.net/04-09-2024/t_e87d9a06e6904d6f97765a0784117913_name_file_960x540_1600_v4_.jpg)
/cloudfront-us-east-1.images.arcpublishing.com/morningstar/T2LGZCEHBZBJJPPKHO7Y4EEKSM.png)
:quality(80)/s3.amazonaws.com/arc-authors/morningstar/78665e5a-2da4-4dff-bdfd-3d8248d5ae4d.jpg)