
Credit Market Insights: Flattening Yield Curve Impacts Performance
Fixed income performance was mixed as the yield curve compressed to its flattest level since before the financial crisis.
/s3.amazonaws.com/arc-authors/morningstar/54f9f69f-0232-435e-9557-5edc4b17c660.jpg)
- Long-duration fixed-income outperformed in the fourth quarter as the yield curve flattened.
- Corporate credit spreads are at, or near, multiyear lows.
- Greater than 3% economic growth momentum continues into the fourth quarter.
- Tax reform should bolster credit quality, but the impact will be idiosyncratic.
Fixed-income performance in the fourth quarter was mixed, as the shape of the yield curve compressed to its flattest level since before the 2008-09 global financial crisis and corporate credit spreads diverged between the investment-grade and high-yield sectors.
Similarly, the year-to-date performance was significantly affected by the flattening curve, as the performance of short-duration indexes was muted, whereas long-duration indexes outperformed. Although there were a few spikes in volatility earlier in the year, volatility was subdued in the fourth quarter and is poised to end the year near historical lows.
Quarter to date through Dec. 20, the yield on the 2-year Treasury bond rose 38 basis points and has risen 67 basis points since the end of last year. At its current yield of 1.86%, the 2-year is trading at its highest yield since October 2008. Yet, while short-term rates have been rising quickly, the yield on the 30-year Treasury bond has only risen 2 basis points this quarter and has dropped 11 basis points thus far this year. At its current yield of 2.88%, the 30-year bond is trading in its lowest quartile since the global financial credit crisis. As of Dec. 20, the spread between the 2-year Treasury and the 10-year Treasury has compressed to 64 basis points, which is only slightly higher from a few days ago when this spread registered its narrowest level since before the global credit crisis.
In the corporate bond market, credit spreads in the investment-grade market have tightened this quarter, whereas credit spreads in the high-yield market have widened slightly. However, although there was a slight divergence this quarter, year to date, corporate credit spreads have tightened across both the investment-grade and high-yield sectors.
Corporate credit markets have been buoyed by a combination of generally improving credit metrics, fewer debt-funded mergers and acquisitions or shareholder-enhancement programs, and the market’s expectation that revisions to tax and regulatory policies will bolster corporate credit strength by invigorating economic growth and boosting earnings.
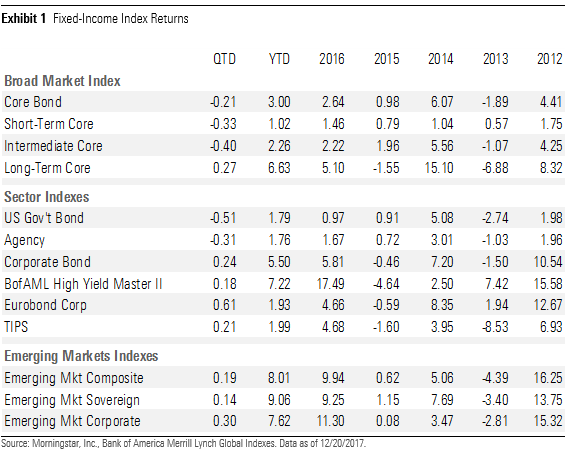
Morningstar’s Core Bond Index, our broadest measure of the fixed-income universe, declined 0.21% in the fourth quarter through Dec. 20. The return was hampered by the increase in interest rates (especially in the short to medium duration), which were only partially offset by tighter credit spreads in the investment-grade corporate bond sector and the yield carry on the underlying securities.
Underlying the Core Bond Index, Morningstar's Short-Term Core Bond Index registered a loss of 0.33% as short-term rates rose to their highest levels in over a decade. The Intermediate Core Bond Index declined 0.40% as rising rates more than offset the yield carry from the underlying bonds in the index. The outperformer this past quarter was the Long-Term Core Bond Index, which edged out a gain of 0.27% as the yield carry offset the negative impact from the slight increase in long-term interest rates.
In the Treasury market, the Morningstar U.S. Government Bond index fell by 0.51%, as the negative impact of rising short-term and intermediate-term rates on bond prices overwhelmed the yield carry for the quarter. Similarly, the Morningstar Agency Bond Index declined 0.31%. After lagging much of the rest of the fixed-income universe in the first half of the year, Treasury Inflation-Protected Securities performed well in the fourth quarter. The Morningstar TIPS Index rose 0.21%, as inflation expectations held steady.
In the corporate bond market, the Morningstar Corporate Bond Index (our proxy for the investment-grade bond market) rose 0.24%, supported by a modest tightening in corporate credit spreads. In the high-yield market, the Bank of America Merrill Lynch High Yield Master Index rose 0.18%, as the higher yield carry of the index was offset by a slight widening of corporate credit spreads in the junk bond market and the increase in medium-term interest rates.
In Europe, tightening credit spreads and lower interest rates helped bolster the Morningstar Euro Corporate Bond Index, which rose 0.61%. Following strong returns in the third quarter, the emerging-markets fixed-income indexes were unable to repeat the performance. Quarter to date, the Morningstar Emerging Market Composite Index rose 0.19%, as the underlying Morningstar Emerging Market Sovereign Index rose 0.14% and the Morningstar Emerging Market Corporate Index rose 0.30%.
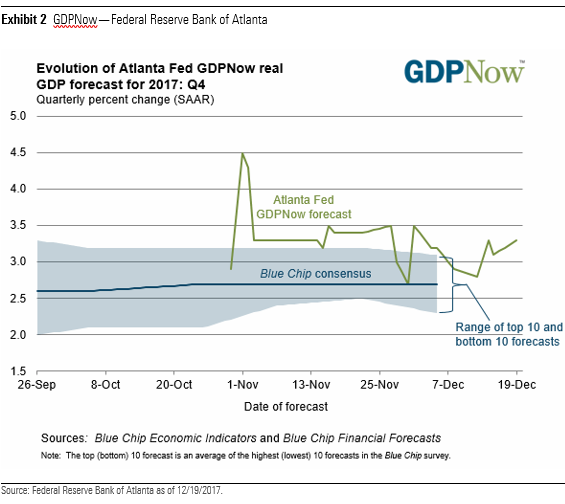
Although weather-related disruptions were expected to affect GDP growth in the third quarter, the economy continued to expand at a healthy pace, rising 3.2% in the third quarter after a 3.1% increase in the second quarter. According to the GDPNow estimate produced by the Federal Reserve Bank of Atlanta, GDP growth for the fourth quarter is expected to rise by 3.3%.
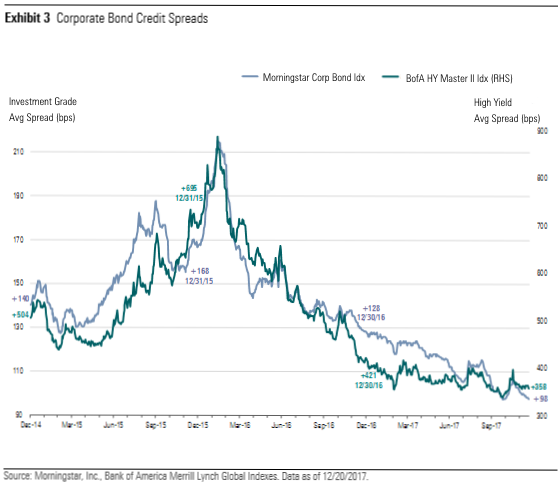
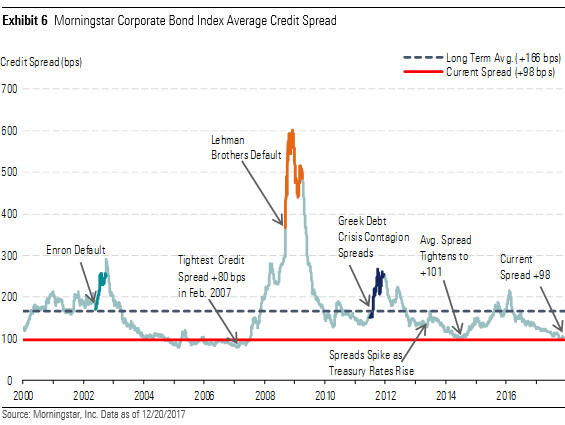
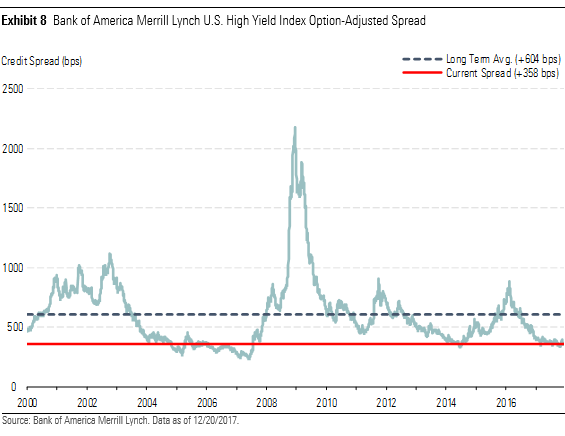
Corporate Credit Spreads At, or Near, Multiyear Lows Since the end of last quarter, through Dec. 20, the Morningstar Corporate Bond Index, our proxy for the investment-grade bond market, tightened 6 basis points to +98; however, in the high-yield market, over the same time period, the Bank of America Merrill Lynch High Yield Master Index widened 4 basis points to +358. At these levels, the credit spread of the Morningstar Corporate Bond Index is at its tightest level since before the global credit crisis, whereas the high-yield index is 20 basis points off of its recent tights, which were hit in late October.
Fundamentals underlying corporate credit risk have generally remained strong, as healthy earnings have led to improving credit metrics and the number of actions companies have undertaken to return capital to shareholders at the expense of bondholders has remained low.
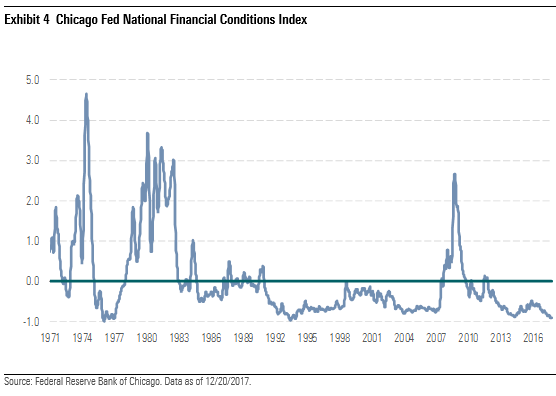
In addition to supportive fundamentals at the company level, the economic outlook remains constructive. For example, financial conditions in the U.S. remain highly accommodative. The Federal Reserve Bank of Chicago publishes a weekly index that measures more than 105 variables to gauge how “loose” or “tight” financial conditions are among U.S. capital markets, as well as the traditional and shadow banking systems. These variables include credit availability and cost, leverage, risk, interest rates, and credit spreads. Index levels above zero indicate tighter than average conditions, whereas levels below zero represent looser than average conditions. The National Financial Conditions Index is currently indicating that financial conditions are at their loosest since October 1994.
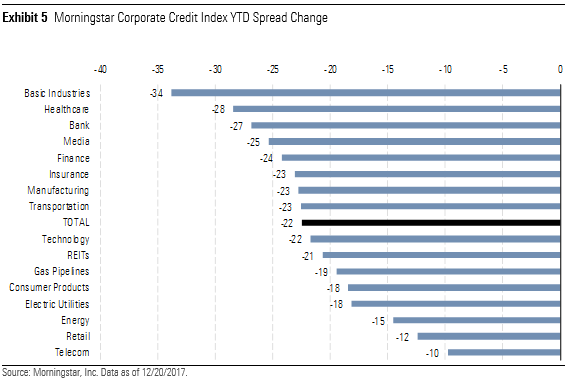
Indicative of the strength of the underlying economy and the expectations for that strength to continue at least over the short term, the most economically sensitive sector year to date, basic materials, has significantly outperformed the overall index. Commodity prices in the mining subsector have seen multiquarter highs amid consistent global demand, and companies in this sector have used cash flow to deleverage their balance sheets.
Although traditionally a more defensive sector, healthcare has tightened the second-greatest amount this year. After President Donald Trump was elected, there were initially concerns that the administration would implement changes that would hurt healthcare companies and lead to lower credit quality. As the risk to credit quality from healthcare reform appears to have dwindled, those concerns have been alleviated. The banking sector has also performed well, as regulatory oversight has limited shareholder-friendly activities that could diminish credit quality, and capital levels generally remain high across the sector as loan losses have continued to be low.
Among the laggards this year, the retail and telecommunications sectors have performed poorly, mainly from secular headwinds, as well as idiosyncratic risk. In the retail sector, lower same-store sales and a shift away from traditional retailers to e-commerce have led to declining credit quality. In the telecommunications sector, the decline in credit quality has mainly been self-inflicted, as management teams look to increase growth through strategic acquisitions, which have been funded by greater amounts of debt, leading to worsening credit quality.
At current levels, both the investment-grade and high-yield indexes are trading much tighter than their long-term historical averages. Since 2000, the average spread of our investment-grade index is +166 and the average spread of the high-yield index has averaged +604.
As an indication of how tight corporate credit spreads have become compared with their historical averages, since the beginning of 2000, the average spread of the Morningstar Corporate Bond Index has registered below the current level only 13% of the time. In addition, not only are credit spreads tighter now than in much of the recent past, the average credit quality of the Morningstar Corporate Bond Index is lower than it had been much of the time. Currently, the average credit quality of the Morningstar Corporate Bond Index is A-, whereas since 2000, the average credit quality has been single A for much of the time.
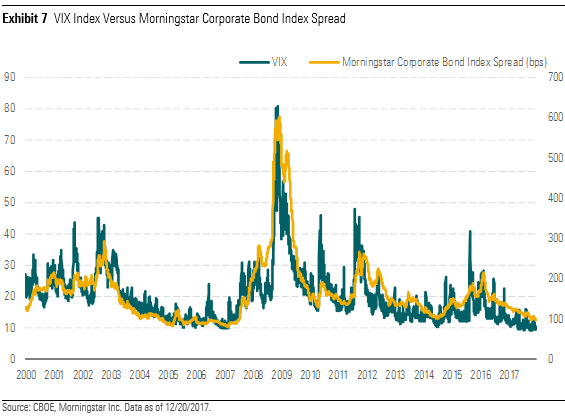
Historically, market volatility and corporate credit spreads have been highly correlated over time. Based on the average spread of the Morningstar Corporate Bond Index since 1990, the VIX and investment-grade credit spreads have a correlation of 85%.
Although earlier this year, there had been brief resurgences in volatility from short-term events such as hurricanes Harvey and Irma, North Korean rocket launches, and terrorist attacks in Europe, volatility in the fourth quarter has remained subdued and is poised to end the year near historical lows. For example, as measured by the CBOE Volatility Index (which measures the market expectations of near-term volatility as conveyed by S&P 500 stock index option prices) volatility has registered near its historical lows. The VIX has averaged 10.3 this quarter and recently dropped below 10, indicating extremely low volatility in the equity markets. Although this may not be a new historical low, there have only been a few instances since 1990 in which the index has registered lower.
In the high-yield market, the average spread of the Bank of America Merrill Lynch High Yield Master Index has registered below its current level less than 13% of the time over the past 17 years. Most of the time that the corporate bond market indexes were tighter than the current credit spread was during the buildup to the 2008-09 credit crisis. In 2004 through 2007, corporate credit spreads were pushed to new historically tight levels as new structured investment vehicles were engineered to arbitrage the differentials in expected default risk; however, once the credit crisis emerged, investors found that many of these vehicles did not perform as advertised.
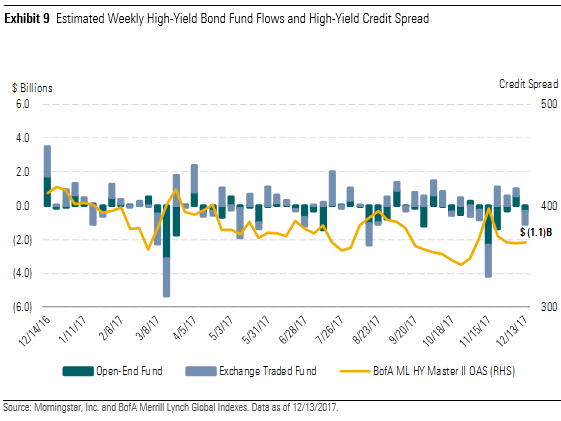
High-Yield Fund Flows Negative for the Year Although corporate credit spreads in the high-yield sector have generally been on a tightening trend in 2017, fund flows in the high-yield asset class have experienced net redemptions. Year to date, the high-yield asset class has suffered total redemptions of $11.7 billion, consisting of $15.2 billion of redemptions in open-end mutual funds, offset by $3.4 billion of new unit creation in exchange-traded funds. Typically, open-end funds are considered a proxy for individual investors who are more influenced by changes in the absolute yield, and ETFs are considered a proxy for institutional investor demand, which is often more correlated to changes in the corporate credit spread.
Tax Reform and Corporate Credit Quality The impact of tax reform on credit quality will generally help improve credit quality for most companies; however, the impact will be highly idiosyncratic depending on those companies that currently pay a high tax rate versus those that are paying a low tax rate. In addition, the impact will depend on how companies decide to use the cash that otherwise would have gone to pay taxes.
With the tax rate dropping to 21% from 35%, multinational corporations will be less inclined to leave earnings sitting in foreign subsidiaries to avoid taxes. The lower tax rate will improve the aftertax free cash flow available in the U.S and allow firms to more economically repatriate foreign earnings for general corporate purposes. In addition, corporations that currently hold significant amounts of cash overseas will be able to repatriate those earnings at a tax rate of 15.5% for cash or cash equivalents or 8% for illiquid assets.
However, while the repatriated cash would improve liquidity in the short term, many firms may not use it to repay debt. For example, Michael Zbinovec, Morningstar’s credit analyst who follows the healthcare sector, estimates that at the end of 2016, Morningstar-rated U.S.-based pharmaceutical companies had over $400 billion in earnings stashed overseas that can now be redomiciled to the U.S. Zbinovec anticipates that pharmaceutical firms may deploy a significant amount of the cash windfall toward shareholder returns, specifically share repurchases, and to augment research pipelines and drug portfolios through meaningful acquisitions. He expects debt reduction to take a back seat to these activities.
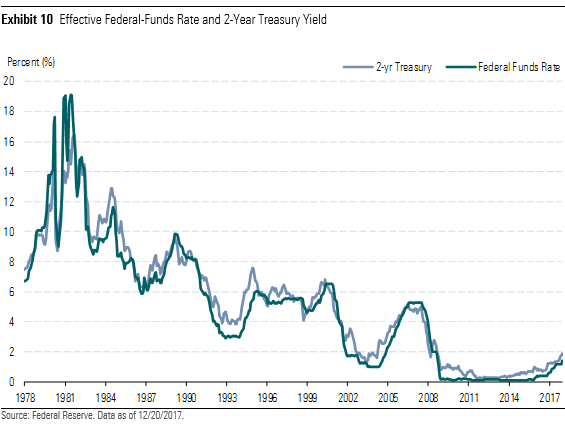
Global Monetary Programs Will Continue to Affect Interest Rates Between raising the federal-funds rate three times in 2017 and initiating its balance sheet normalization program in October, the Federal Reserve has taken steps to begin normalizing monetary policy. As a result, in anticipation of the increases in the federal-funds rate, the yield on the 2-year Treasury bond has been steadily rising over the past few years. Based on the Fed's statements and its own interest-rate forecasts, as well as the heightened probability for rate increases priced into the futures market, it appears that short-term rates are headed higher in 2018.
In its December statement, the Fed specifically noted that the labor markets have continued to strengthen and that the economy has been growing at a steady rate. In addition, the Fed highlighted that “Household spending has been expanding at a moderate rate, and growth in business fixed investment has picked up in recent quarters.” However, as it may limit the extent of future monetary policy actions, the Fed noted that inflation was running below its 2% target: “On a 12-month basis, both overall inflation and inflation for items other than food and energy have declined this year and are running below 2 percent.” After its December meeting, the Federal Reserve released its updated projections, including the forecasts by board members for the federal-funds rate for the next three years of 2%, 2.70%, and 3%, for years ended 2018, 2019, and 2020.
In addition to raising the federal-funds rate, the balance sheet reduction program will scale back the Fed’s current reinvestments of its portfolio. In October, the Fed began to allow $10 billion of assets to roll off per month and plans to increase the pace by an additional $10 billion per month every three months until it reaches a total monthly run-off rate of $50 billion (an annual run rate of $600 billion). Considering the total amount of assets currently held by the Federal Reserve banks was approximately $4.5 trillion when this program began, this is a very modest pace of reduction. Over the course of the first 12 months of this program, if the Fed increases the reduction each quarter, the total amount of reduction would be $350 billion. From there, the total amount of reduction by October 2018 would be just shy of $1 trillion. Depending on the amount of assets it will want to retain on its balance sheet, the Fed will have let $2.75 trillion roll off by October 2022, which would leave approximately $1.75 trillion.
The yield curve has been on a multiyear flattening trend since the Fed ended its quantitative easing program in October 2014, and the flattening has continued since the Fed began to raise the federal-funds rate in December 2015 in its pursuit to normalize monetary policy. Currently, as measured by the spread between the 2-year and 10-year bond, the yield curve is at its flattest level since before the global financial crisis.
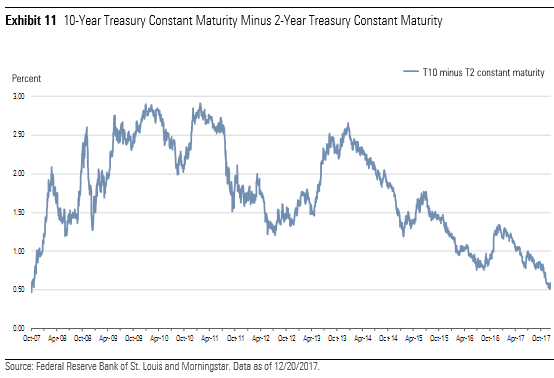
Historically, a flattening yield curve has been a leading indicator of a potentially weakening economy, However, this time around, this signal may be distorted by global central bank actions. The economy appears to be on solid footing in the near term, as the GDPNow model forecast produced by the Federal Reserve Bank of Atlanta for real GDP growth in the fourth quarter is 3.3%. This follows a relatively strong growth rate in the third quarter of 3.2% and a 3.1% growth rate in the second quarter.
The short end of the curve is being directly influenced by the Federal Reserve, which is expected to continue hiking short-term rates, whereas the long end of the curve may be influenced by the ongoing quantitative easing programs of the European Central Bank and Bank of Japan. Even though the 10-year U.S. Treasury is yielding only 2.50%, that yield has been attractive to global bond investors as the yield on Germany’s 10-year bond is only 0.41%, and the yield on Japan’s 10-year bond is only barely positive at 0.06%.
Among global central bank activity, the European Central Bank announced that it would not begin to taper its asset purchase program until next year. Even then, the ECB will continue to purchase EUR 30 billion per month until September 2018, additionally, the ECB noted that the purchases could be extended if warranted. Although this places the ECB on the path toward a more normalized monetary policy late next year, these purchases will still infuse the eurozone with an additional EUR 270 billion of new money that will likely look to be reinvested in fixed-income securities.
Quarter-End Insights
Stock Market Outlook: A Dearth of Opportunity Amid the Rally Basic Materials: The Most Overvalued Sector We Cover Energy: A False Sense of Security for Oil Markets Communication Services: A Deal Eludes Sprint and T-Mobile Consumer Cyclical: E-Commerce a Key Threat for Some, But Not All Consumer Defensive: Hungering for Top-Line Gains Financial Services: Asset Managers Are Forced to Adapt Healthcare: Pick Carefully as Valuations Head Higher Industrials: Pockets of Uncertainty Present a Few Opportunities Real Estate: Slow but Steady Climb Continues Technology: Most Bellwethers Are Overvalued Utilities: A Weak December Could Foreshadow a Tough 2018 Venture Capital Outlook: Dry Powder for Late-Stage Deals Private Equity Outlook: Eyewatering Acquisition Multiples Crypto Asset Outlook: Installation Phase
/cloudfront-us-east-1.images.arcpublishing.com/morningstar/G3DCA6SF2FAR5PKHPEXOIB6CWQ.jpg)
/cloudfront-us-east-1.images.arcpublishing.com/morningstar/6ZMXY4RCRNEADPDWYQVTTWALWM.jpg)
:quality(80)/s3.amazonaws.com/arc-authors/morningstar/54f9f69f-0232-435e-9557-5edc4b17c660.jpg)