
Top 10 Holdings of Our Ultimate Stock-Pickers' Index
While healthcare names continue to present opportunities, our lists revealed names from other sectors that may be compelling.

By Joshua Aguilar | Associate Equity Analyst
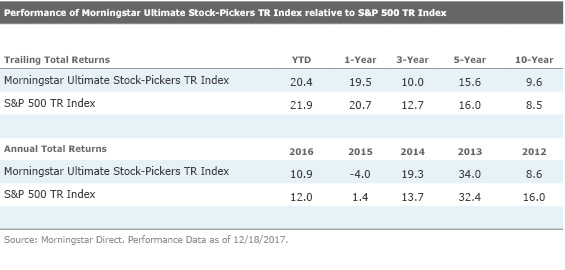
Every fund investor would like to see the manager of the actively managed funds that they own beat the market every year, but they've been left wanting for well over a decade.
The lack of consistent outperformance on the part of large-cap active managers (the main contributors to the Ultimate Stock-Pickers concept) has been well-documented by the S&P Indices Versus Active Funds (SPIVA) U.S. Scorecard. For the five-year period ending in June 2017, the index group noted that 82.4% of active large-cap fund managers had on average underperformed the S&P 500 TR Index.
The results have been similar across all investing styles. A paltry 11.4% of large-cap value managers have outperformed their index versus 14.9% of large-cap core managers and 23.6% of large-cap growth managers outperforming their respective benchmarks.
Unsurprisingly, the gap in year-over-year performance between the S&P 500 TR Index and large-cap active equity managers persisted on the heels of the postelection rally, as market expectations broadly lifted all stocks, seemingly regardless of valuation. At the midpoint of 2017, however, large-cap active equity managers outpaced the benchmark index by 153 basis points.
For year-to-date performance as of the end of December, Morningstar's own large-cap core (20.5%), large-cap growth (26.9%), and large-cap value (14.2%) categories have posted returns that reveal that value continues to appear relatively out of favor compared with growth. This suggests that out of all investment styles, value-oriented managers have continued to face headwinds against the S&P 500 TR Index this year, with the Morningstar large-cap value trailing the total returns of the index by 626 basis points.
The fund managers represented in our Ultimate Stock-Pickers concept have had their own issues with relative long-term performance, with their year-to-date, 1-, 3-, and 5-year performance levels being the biggest detractors. While we had 10 of our 22 top fund managers beating the S&P 500 on a 10-year basis at the end of last week, just three and five managers, respectively, were beating the benchmark on a 3- and 5-year basis, lending credence to the argument that current valuations have made for a difficult stock-picking environment.
As a reminder, the Ultimate Stock-Pickers concept was devised as a stock-picking screen, not as a guide for finding fund managers to add to an investment portfolio. Our primary goal has been to identify a sufficiently broad collection of stock-pickers who have shown an ability to beat the markets over multiple periods (with an emphasis on longer-term periods). We then cross-reference these top managers' top holdings, purchases, and sales against the recommendations of our own stock analysts on a regular basis, allowing us to uncover securities that investors might want to investigate further. There will always be limitations to our process, as we try to focus on managers that our fund analysts cover, and on companies that our stock analysts cover, which reduces the universe of potential ideas that we can ultimately address in any given period. This is also the main reason why we focus so much attention on large-cap fund managers, as they tend to be covered more broadly on the fund side of our operations and their stock holdings overlap more heavily with our active stock coverage.
That said, by limiting themselves to the largest and most widely followed companies, our top managers may miss out on some smaller ideas that have the potential to generate greater outperformance in the long run. Markets have continued to rally since the election of U.S. President Trump into this year. A Senate bill to pass comprehensive U.S. tax reform has only added fuel to this rally, with markets now trading moderately above our own analysts' fair value estimates, with our market fair value ratio at 105% at the end of last week (against an all-time high of 114%).
Taking a look at the cyclically adjusted price/earnings, or CAPE, ratio, which divides the current market price by the average of 10 years of earnings (adjusted for inflation), it currently stands at around 32.7. This is compared with a historical mean of 16.8 and median of 16.2, with Shiller relying on market data from both estimated (1881-1956) and actual (1957 onward) earnings reports from companies represented in the S&P 500 Index. It also represents the second highest ratio in history, behind only the dot-com bubble, and ahead of events like Black Tuesday, which preceded the Great Depression. Historical values have ranged from a low of 4.78 before the bull market run of the 1920s and 44.2 at the end of the dot-com bubble in late 1999. The CAPE ratio is generally used to assess potential returns from equities over longer time frames, with higher-than-average CAPE values implying lower-than-average long-term annual returns going forward, which is what we're gleaning from the current ratio. While not intended to be an indicator of impending market crashes, it has provided warning signs for investors in the past.
Aside from tracking the holdings, purchases, and sales as well as the ongoing investment performance of our Ultimate Stock-Pickers, we also follow the makeup and results of the Morningstar Ultimate Stock-Pickers TR Index. For those who may not recall, the Ultimate Stock-Pickers index was set up to track the highest-conviction holdings of 26 different managers, a list that includes our 22 top fund managers as well as the investment managers of four insurance companies—
The index itself is composed of three subportfolios—each one containing 20 securities—that are reconstituted quarterly on a staggered schedule. As such, one third of the index is reset every month, with the 20 securities with the highest conviction scores making up each subportfolio when they are reconstituted. This means that the overall index can hold anywhere between 20 and 60 stocks at any given time (because some stocks may remain as the highest-conviction score holders in any given period, meaning there can be overlaps in the holdings, reducing the total number of different stocks held). In reality, the index is usually composed of 35 to 45 securities, holding 38 stocks in all at the end of December. These stocks should represent some of the best investment opportunities that have been identified by our Ultimate Stock-Pickers in any given period. It can also have more concentrated positions than one might find in a typical mutual fund, with the top 10 (25) holdings in the index accounting for 49.7% (85.0%) of the total invested portfolio at the end of last month. The size and concentration of the portfolio does change, though, as this is an actively managed index that tries to tap into the movements and conviction levels of our top managers over time.
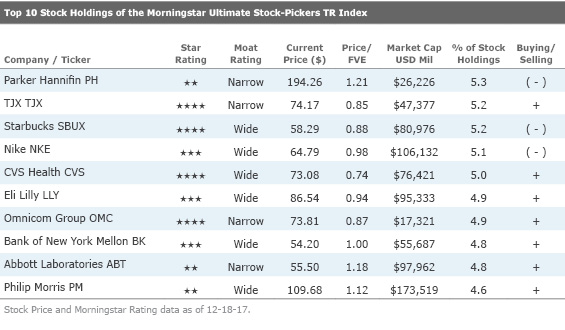
Looking at the top 10 stock holdings of the Morningstar Ultimate Stock-Pickers index at the end of May, there are currently only a couple of names trading at over a 15% discount to our analysts' fair value estimates, more or less in line with the results from our last publication. Wide-moat-rated
Lekraj further views this strategic move as a positive from an operational standpoint. He sees the new CVS/Aetna entity as a healthcare-services behemoth with the infrastructure to sell insurance and manage/treat members through every aspect of their treatment regimens. That said, Lekraj remains concerned that CVS is materially overpaying for Aetna. Lekraj also covers Aetna and believes CVS will essentially pay nearly double what he believes Aetna is worth on a stand-alone basis. Lekraj concludes that CVS and Aetna will be under significant pressure to execute an integration that has minimal issues. Given the complex and large nature of both entities, Lekraj believes there is material risk that shareholder value may be impaired. As a result, Lekraj recently lowered his fair value estimate for CVS to $99 from $109.
Nevertheless, Lekraj believes CVS' pharmacy benefit manager operations position it for long-term success as the combined need to control costs and build efficiency into the healthcare market will grow ever more critical over the coming decades for payers. Offsetting CVS overpaying for Aetna will be some moderate cost and operational synergies over the long term. He points out that CVS is one of the largest PBMs, with services that help its payer clients attain better pricing and member management efficiency. Ultimately, he thinks that the combination of a solid business model and positive secular industry trends will drive excellent returns on capital for the healthcare behemoth.
Finally, Lekraj points out that CVS also owns the largest network of retail pharmacies in the U.S. He thinks that the firm will seek to turn these retail locations into healthcare hubs, where patients and members can obtain a plethora of healthcare services and products. Eventually, he thinks these hubs will play a key role for a new CVS/Aetna entity and will allow the new firm to drive member healthcare costs even lower.
Narrow-moat-rated
Multiple factors reassure Weishaar that weak third-quarter comparable sales performance was an anomaly. First, the company faced difficult comps, with a 5% comp in the third quarter of last year. Second, like other retailers, hurricanes and warm weather create a headwind amounting to 2% by management estimates. Third, the company as a whole experienced no traffic issues, with traffic up across all divisions, indicating to her that demand appears intact. Fourth, pricing structure also appears intact, with merchandise margin growing in the quarter. Lastly, weakness appeared contained to the Marmaxx division (comparable-store sales down 1%) and did not spread to other banners (Homegoods comparable-store sales increased 3%, TJX Canada was up 4%, and TJX International was up 1%). As a result, Weishaar believes this all points to a fixable problem due partly to weather and partly to missing fashion trends, which she sees as remediable given open to buy capabilities.
Weishaar thinks TJX can achieve an average 3% annual same-store sales growth rate over the next five years, driven by increased visits from existing customers, new customer acquisition with new marketing campaigns and e-commerce-driven awareness, especially in the younger demographic, and as the steady stream of new stores scales. Furthermore, Weishaar points out that TJX's target market is broad and allows for expansion to a range of markets. Because merchandise can be obtained from such a wide variety of vendors and proprietary systems allow for differentiation of floor plan and merchandising to match local demand, she estimates that stores in current markets can grow almost 50%, and eventual expansion into additional European markets make room for almost 1,000 more storefronts. She also thinks constant-currency operating income growth will slightly outpace revenue growth, driven by improved inventory turns and the scaling of the HomeGoods, Trade Secret, and TJX Europe businesses offset by wage inflation in the near term. Finally, her model assumes low-double-digit average annual earnings per share growth over the next five years, driven by 6.9% revenue growth, 7.4% operating income growth, and an almost 2% benefit from share buybacks. As a result, and in spite of near-term headwinds, she sees little to change her $87 fair value estimate.
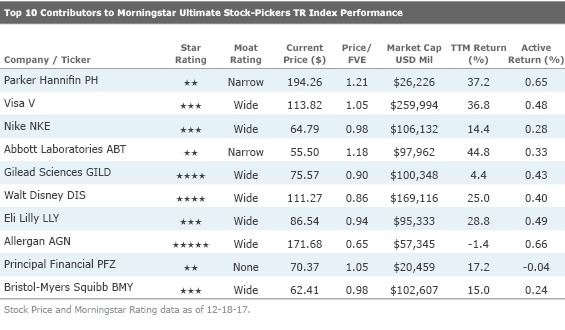
Looking at the year-over-year performance of the Morningstar Ultimate Stock-Pickers index from Dec. 1, 2016, to Nov. 30, 2017, two attractive standouts from the top 10 contributors included communication services and wide-moat-rated name
Analyst Neil Macker covers the well-known Mickey Mouse name, with shares currently trading at a 14% discount to his fair value estimate. The company recently announced that it will purchase a substantial portion of
Disney's recent results reveal that revenue for the quarter fell 3% year on year to $12.8 billion. Media networks revenue dropped by 3% as the 11% decline at the broadcasting segment more than offset the flat quarter at cable networks. Affiliate fee revenue was up 4% in the quarter, with growth at both cable and broadcasting. Disney has about 50% of its subscriber base up for renewal by the end of 2019. Parks and resorts growth of 6% reflected the growth at both Shanghai and Paris, which Macker believes more than offsets the hurricane impact on domestic operations. Macker relays that management disclosed capital expenditures would be $1 billion higher in fiscal 2018 as the company looks to complete the Toy Story Lands in Shanghai and Orlando, as well as the buildouts of the two Star Wars Lands. The 21% revenue decline at the studio was further due to the weaker performance of Cars 3 in the quarter versus Finding Dory last year. EBITDA for the firm fell 11% to $2.8 billion, which Macker states was due in part to lower revenue, along with increased marketing and programming costs.
That said, Macker is convinced that Disney has a strong fiscal 2018 movie slate that kicked off with the third installment of the Thor series and Pixar's Coco. The firm plans to release three more Marvel films, including the third Avengers film, which are traditionally the highest grossing films in the Marvel Cinematic Universe. The slate also includes two Star Wars films—Episode VIII and a stand-alone film focused on interstellar swashbuckler Han Solo. Pixar will also release the sequel to the Incredibles. Macker projects that the 2018 slate will handily beat the weak 2017 one while also outperforming the strong 2016 slate, which included Star Wars Episode VII, Zootopia, Captain America: Civil War, and Finding Dory.
Furthermore, CEO Bob Iger also discussed Disney’s two recently announced direct-to-consumer over-the-top offerings. The first to launch will be ESPN Plus in the spring of 2018. This product will be part of the redesigned ESPN App, which will also stream the regular ESPN channels on an authenticated basis. ESPN Plus will feature broadcasts of sports rights that ESPN holds but does not air on its regular channels. Macker also expects that the service will also feature eSports, an area of focus for ESPN over the past few years.
Finally, the Disney-branded OTT service will launch in the second half of 2019, around the time that the
As for wide-moat Allergan, which is the other name of interest to us, the firm currently trades at a 35% discount to analyst Michael Waterhouse's fair value estimate. While Waterhouse recently lowered his fair value estimate to $263 per share from $273, he still views Allergan as a compelling bargain.
In spite of an earnings loss for the generic Restasis launch, he thinks Allergan can maintain mid-single-digit growth over the next few years thanks to its defensible product franchises, low near-term generic risk, and new product launches. Waterhouse anticipates particularly strong growth in Allergan's aesthetics, neurosciences, and gastrointestinal segments, thanks largely to strong Botox sales and continued growth from facial fillers, Kybella for chin fat, and Linzess and Viberzi in irritable bowel syndrome. Drugs like Namzaric and Vraylar should also help offset pressure on Allergan's Namenda franchise, in Waterhouse's view. Waterhouse further thinks the recent acquisitions of regenerative medicine company LifeCell combined with Zeltiq's body sculpting equipment should support consistent growth in Allergan's medical aesthetics segment.
Additionally, Waterhouse points out that even though Allergan's planned merger with
Waterhouse expects Allergan will remain focused on expanding its branded pipeline and salesforce productivity through small acquisitions and licensing partnerships. In his view, Allergan also has one of the stronger industry partnerships with Amgen for developing biosimilars, which face stringent manufacturing, regulatory, and marketing hurdles. All in all, after shedding its generics and distribution segments, and given its low tax rate, Waterhouse points out that Allergan remains a highly profitable business, and he forecasts a free cash flow margin near 30%. While he acknowledges some gross margin erosion as increasing royalty payments combined with higher marketing costs on near-term launches come about, he thinks Allergan can sustain an EBITDA margin over 40%, which includes his estimate on ongoing milestone payments. Waterhouse models approximately 16% of revenue will be dedicated to research and development spending, which includes 10% internal spending and 6% from ongoing milestone payments and external licensing. All this leads him to conclude that Allergan stock is worth considering and merits further inspection given the attractive price.
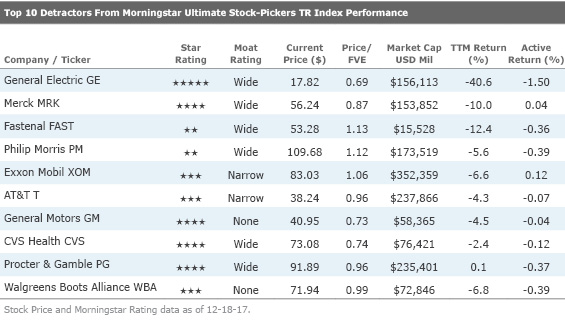
Finally, as for the largest detractors, no-moat
Whiston thinks GM's earnings potential is excellent because the company finally has a healthy North American unit and can focus its U.S. marketing efforts on just four brands instead of eight. He believes the most critical cost-saving measure was setting up a voluntary employees' beneficiary association for the retiree healthcare costs of the United Auto Workers. According to Whiston, this saves GM about $3 billion a year. Whiston adds that other benefit concessions and plant closings have drastically lowered GM North America's break-even point to U.S. industry sales of about 10 million-11 million vehicles, assuming 18%-19% share. He expects further scale to come from GM moving its production to 99% on global platforms by 2020 from just 39% in 2010. By 2025, Whiston points out that GM will move its production onto four vehicle sets for even more flexibility and scale.
Whiston believes that GM makes products that consumers are willing to pay more for than in the past. It no longer has to overproduce in an attempt to cover high labor costs and then dump cars into rental fleets (which hurts residual values). GM now operates in a demand-pull model where it can produce only to meet demand, is structured to do no worse than break even at the bottom of an economic cycle, and is about to see the upside to having a high degree of operating leverage. The result will be higher profits despite lower U.S. market share.
Finally, Whiston also likes GM embracing the opportunity of ride-sharing and ride-hailing and selling Opel/Vauxhall. He thinks actions such as a 9% investment in Lyft for $500 million, buying Cruise Automation, and unifying all of GM’s legacy car-sharing activities under the Maven brand, along with GM’s connectivity and data-gathering via OnStar, position GM well for this new era.
If you’re interested in receiving e-mail alerts about upcoming articles from The Ultimate Stock-Pickers Team, please sign up here.
Disclosure: Joshua Aguilar has ownership interests in Berkshire Hathaway (BRK.B) and The Walt Disney Co. (DIS), while Eric Compton has an ownership interests in Berkshire Hathaway (BRK.B). It should also be noted that Morningstar's Institutional Equity Research Service offers research and analyst access to institutional asset managers. Through this service, Morningstar may have a business relationship with fund companies discussed in this report. Our business relationships in no way influence the funds or stocks discussed here.
/cloudfront-us-east-1.images.arcpublishing.com/morningstar/PLMEDIM3Z5AF7FI5MVLOQXYPMM.jpg)
/cloudfront-us-east-1.images.arcpublishing.com/morningstar/I53I52PGOBAHLOFRMZXFRK5HDA.jpg)
/cloudfront-us-east-1.images.arcpublishing.com/morningstar/CEWZOFDBCVCIPJZDCUJLTQLFXA.jpg)