
Rolling Returns: A Powerful Analytical Tool That Anyone Can Use
Rolling period returns can provide a fuller view of a fund's performance than you can get by looking at a single-period trailing return.
/s3.amazonaws.com/arc-authors/morningstar/3a6abec7-a233-42a7-bcb0-b2efd54d751d.jpg)
Q: Should I be looking at or calculating rolling returns? It sounds complicated, and I wonder if it's worth the extra work.
A: Rolling period returns can provide a more in-depth view into a fund's performance history than you can get by looking at a single-period trailing return. In a way it's like comparing a panoramic photo of a forest to a snapshot of a small group of trees.
They're an extremely valuable tool for analyzing fund performance, and they're probably not as onerous to access and interpret as you think. Let's look at how rolling period returns differ from point-in-time returns and how investors can find them and use them.
Standard Performance Periods Funds report their performance in standard short, intermediate, and longer time periods, such as three months, year to date, one year, and annualized three-, five-, and 10-year periods. This is helpful because it allows investors to assess an investment's performance over different time frames, but it also allows for easier comparisons among investments. Can you imagine if funds were allowed to report customized periods that highlight their best performance? Performance comparisons among funds would be impossible, and the time periods reported could be so short that they weren't even meaningful.
Morningstar further helps investors compare apples to apples by separating funds into peer groups and assigning funds a rank in category based on its trailing return over these standardized periods. (Note: Our category ranks are descending, meaning smaller is better.) If you look at the Performance tab on any fund's quote page on Morningstar.com, you'll see this table in the middle of the page that will help you quickly assess a fund's absolute performance as well as its performance relative to peers and the benchmark over a variety of time periods.
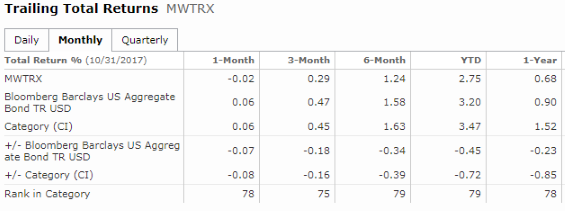
But, of course, standardized periods tell only part of the story because they are specific to only one discrete period. For instance, if you look at a fund's five-year return on Morningstar.com right now, that is how the fund performed over the period beginning Nov. 1, 2012, and ended Oct. 31, 2017.
How Rolling Returns Are Different Rolling returns offer a wider-angle lens into a fund's full return history. In addition to looking at a fund's most recent five-year return you could also look at how it performed over many overlapping 60-month periods as far back as your performance data goes, or as far back as the current manager has been in charge, which can help you gain a fuller understanding of its historical performance trends throughout five-year holding periods in a variety of market environments.
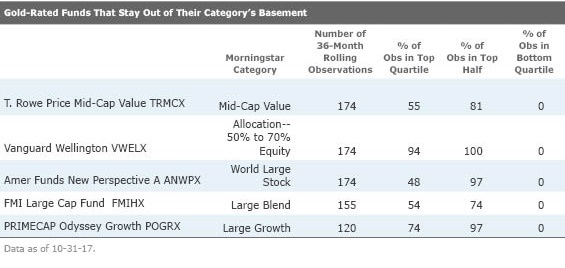
You can slice and dice funds' rolling returns in a variety of ways depending on what you want to see. Let's say I was interested in finding funds with very specific past performance trends: I want a list of highly rated funds that have landed in their category's top half about three quarters of the time and have never landed in their category's bottom quartile, over rolling three-year periods, going back a maximum of 15 years but a minimum of 10. Also, the current manager (or at least a key player on the team) has to have been running the fund over that whole period. (Before you email me about the omission,
To come up with this list, using Morningstar Direct software, I first whittled down our coverage list by screening for all mutual funds that earn a Morningstar Analyst Rating of Gold. Then, I took the funds on that list and calculated rolling 36-month returns up to a maximum of 15 years.
Morningstar Direct is a robust tool that allows users to perform all sorts of highly customized calculations. But Morningstar.com readers can access rolling returns to see performance trends over different periods, too.
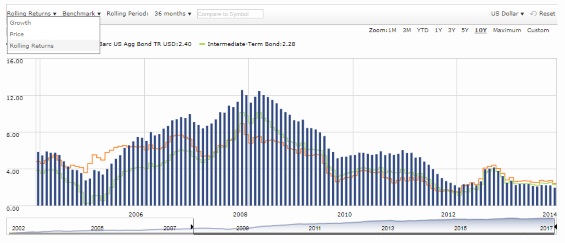
To find a fund's rolling returns, click on the Chart tab on the page for an individual mutual fund. You'll be directed to the fund's Growth of $10,000 chart. Toggle over the Growth tab, and you'll get a drop-down menu. Select the Rolling Returns option. The default is the three-month rolling returns for the investment: how often it was in the black in various three-month periods as well as how often it posted negative returns. You can change this default to six months, one year, three years, or five years, with a one-month step. You will also see the performance of the relevant category and benchmark.
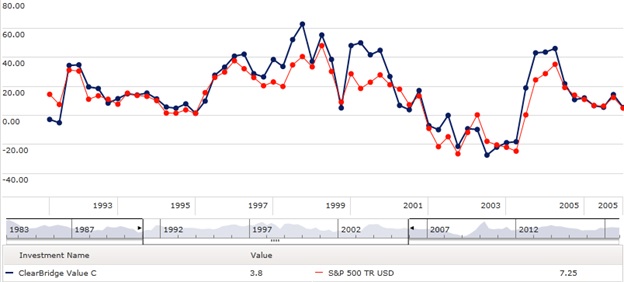
The 'Streak'
Here's some fun rolling returns trivia: If you've been investing or researching investments a while, you might remember Bill Miller's 15-year "streak" versus the S&P 500 at the fund then known as Legg Mason Value Trust (now
- source: Morningstar Direct
/cloudfront-us-east-1.images.arcpublishing.com/morningstar/GQNJPRNPINBIJGIQBSKECS3VNQ.jpg)
/cloudfront-us-east-1.images.arcpublishing.com/morningstar/EC7LK4HAG4BRKAYRRDWZ2NF3TY.jpg)
/cloudfront-us-east-1.images.arcpublishing.com/morningstar/JNGGL2QVKFA43PRVR44O6RYGEM.png)
:quality(80)/s3.amazonaws.com/arc-authors/morningstar/3a6abec7-a233-42a7-bcb0-b2efd54d751d.jpg)