
Credit Market Insights: A Solid Quarter for the Bond Markets
A brief bout of volatility kept interest rates low this quarter, while ongoing healthy corporate fundamentals supported corporate credit spreads.
/s3.amazonaws.com/arc-authors/morningstar/54f9f69f-0232-435e-9557-5edc4b17c660.jpg)
- Brief bout of volatility quickly dissipates.
- Fixed-income indexes generate solid returns.
- Corporate credit spreads nearing multi-year lows.
Asset markets experienced a brief blip of volatility mid-quarter as measured by the CBOE Volatility Index (VIX). However, the VIX subsequently dwindled back toward its historical lows as Hurricanes Harvey and Irma caused only short-term market dislocations. Additionally, among geopolitical tensions, investors have become inured to North Korean rocket launches (the 12th thus far this year) and terrorist attacks in Europe.
Fixed-income indexes performed well during the third quarter of 2017 as the brief bout of volatility kept interest rates low, whereas ongoing healthy corporate fundamentals supported corporate credit spreads. Corporate credit markets have been buoyed by a combination of generally improving credit metrics, fewer debt-funded M&A or shareholder enhancement programs, and the market's expectation that possible revisions to tax and regulatory policies expected to be enacted by the Trump administration will reinvigorate economic growth and boost earnings. Additionally, the fixed-income market benefited from a flattening yield curve in which interest rates across the medium and longer end of the yield curve declined, thus bolstering long-term fixed-income indexes.
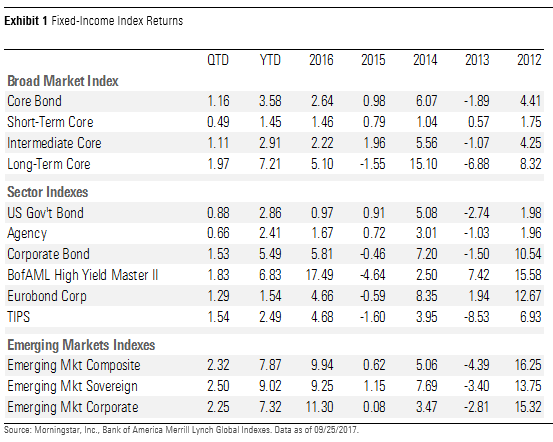
Morningstar's Core Bond Index, our broadest measure of the fixed-income universe, rose 1.16% in the third quarter through Sept. 25. The return was generated by a combination of the yield carry on the underlying securities, the positive impact from lower long-term interest rates, and tighter credit spreads. The Short-Term Core Index has only risen 0.49% thus far this quarter as rising short-term interest rates pressured returns, whereas the Intermediate Core Index and the Long-Term Core Indexes have risen 1.11% and 1.97%, respectively, benefiting from declining long-term interest rates.
Representative of the Treasury market, the Morningstar U.S. Government Bond index rose by 0.88%, and the Morningstar Agency Bond Index rose 0.66%. After lagging much of the rest of the fixed-income universe earlier this year, Treasury inflation protected securities began to catch up to other sector returns. The Morningstar TIPS Index rose 1.54% as inflation expectations bounced off their lows in June in response to the increase among commodity prices, especially oil. In the corporate bond market, the Morningstar Corporate Bond Index (our proxy for the investment-grade bond market) rose 1.53%, supported by a slight decrease in long-term interest rates and modestly tightening credit spreads. In the high-yield market, the Bank of America Merrill Lynch High Yield Master Index rose 1.83%, as tightening credit spreads drove a significant amount of the performance. With its shorter duration, declining long-term interest rates did not impact the high-yield market as much as the investment-grade index. In Europe, tightening credit spreads and lower interest rates helped to bolster the Morningstar Euro Corporate Bond Index, which rose 1.29%.
The emerging-markets fixed-income indexes continued to post solid returns in the third quarter, benefited by the low volatility environment and investor appetite for riskier assets. The Morningstar Emerging Market Composite Index rose 2.32%, as the underlying Morningstar Emerging Market Sovereign Index rose 2.50% and the Morningstar Emerging Market Corporate Index rose 2.25%.
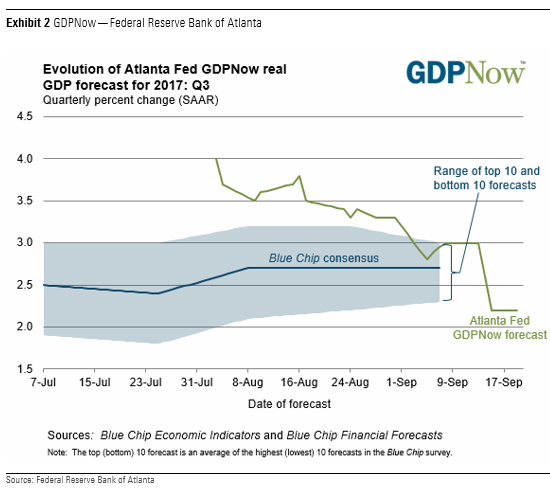
GDP rose at a healthy 3.0% pace in the second quarter, which helped to support corporate credit quality; however, third-quarter growth is expected to decelerate from the second quarter as weather-related disruptions will act as a headwind in the short term. These headwinds are expected to be temporary, and economic growth should even out over the medium term. As of Sept. 19, the GDPNow estimate produced by the Federal Reserve Bank of Atlanta for third quarter is 2.2%.
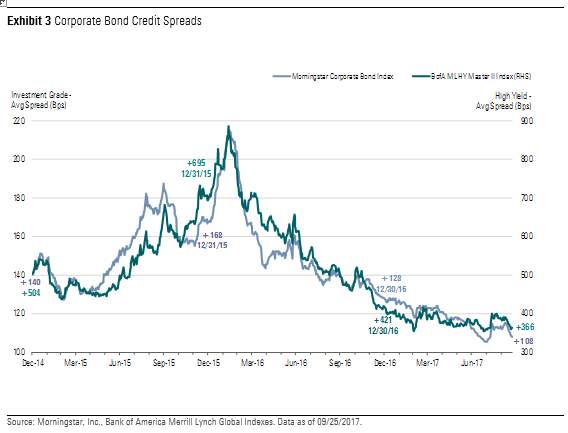
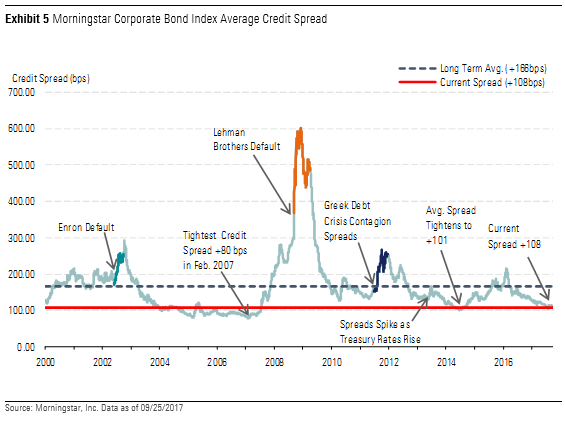
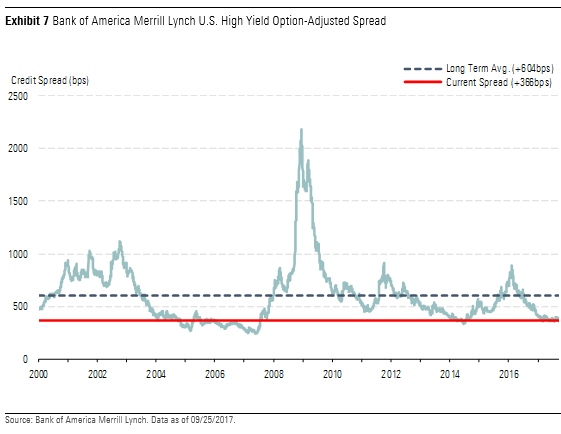
Corporate Credit Spreads Nearing Multi-Year Lows Since the end of last quarter through Sept. 25, the Morningstar Corporate Bond Index, our proxy for the investment-grade bond market, tightened 4 basis points to +108, and the Bank of America Merrill Lynch High Yield Master Index tightened 11 basis points to +366. Most recently, corporate credit spreads had bottomed out at +106 and +355, respectively, at the end of July. Over the past few years, the tightest that credit spreads have registered were in mid-2014 when they reached +101 and +335, respectively. Prior to then, credit spreads have only ever been tighter in the runup to the 2008-09 credit crisis.
Fundamentals underlying corporate credit risk have generally remained strong as healthy earnings have led to improving credit metrics and the number of actions companies have undertaken to return capital to shareholders at the expense of bondholders has remained low.
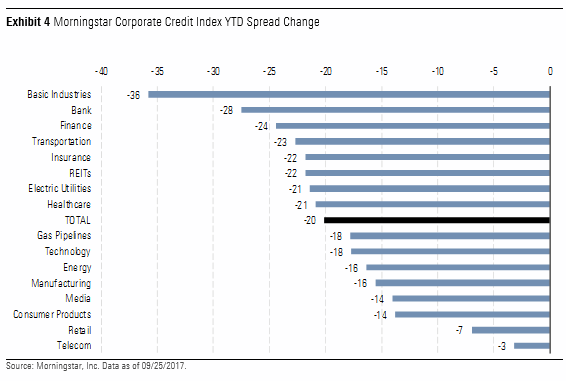
Year to date, among the sectors that comprise the index, the basic materials sector has significantly outperformed the overall index as commodity prices in the mining subsector have seen multi-quarter highs amidst consistent global demand. The banking sector has performed well as regulatory oversight has limited shareholder-friendly activities that could diminish credit quality, and capital levels generally remain high across the sector as loan losses have continued to be low.
Among the laggards this year, the retail and telecommunications sectors have performed poorly. In the retail sector, lower same-store sales and a shift away from traditional retailers to e-commerce have led to declining credit quality. In the telecommunications sector, the decline in credit quality has mainly been self-inflicted, as management teams look to increase growth through strategic acquisitions, which have been funded by greater amounts of debt, leading to worsening credit quality.
At current levels, both the investment-grade and high-yield indexes are trading much tighter than their long-term historical averages. Since 2000, the average spread of our investment-grade index is +166 and the average spread of the high-yield index has averaged +604. As an indication of how tight corporate credit spreads have become compared with their historical averages, since the beginning of 2000, the average spread of the Morningstar Corporate Bond Index has registered below the current level only 20% of the time.
In addition, not only are credit spreads tighter now than in much of the recent past, the average credit quality of the Morningstar Corporate Bond Index is lower than it has been much of the time. Currently, the average credit quality of the Morningstar Corporate Bond Index is A-, whereas since 2000, the average credit quality has been either closer to, or a single A for much of the time.
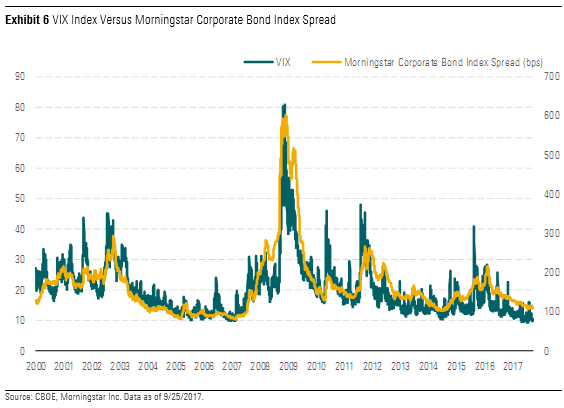
Hurricanes Harvey and Irma, North Korean rocket launches, and minor terrorist attacks in Europe had led to a brief resurgence in volatility mid-quarter, but the level of the CBOE Volatility Index (which measures the market expectations of near-term volatility as conveyed by S&P 500 stock index option prices) dwindled back toward its historical lows. Recently, the VIX dipped below 10, indicating extremely low volatility in the equity markets. While this may not be a new historical low, there have only been a few instances since 1990 in which the index has registered lower. Market volatility and corporate credit spreads have been highly correlated over time. Based on the average spread of the Morningstar Corporate Bond Index since 1990, the VIX and investment-grade credit spreads have an r-square of approximately 85%.
In the high-yield market, the average spread of the Bank of America Merrill Lynch High Yield Master Index has registered below its current level less than 14% of the time over the past 17 years. Most of the time that the corporate bond market indexes were tighter than the current credit spread was during the buildup to the 2008-09 credit crisis. In 2004 through 2007, corporate credit spreads were pushed to new historically tight levels as new structured investment vehicles were engineered to arbitrage the differentials in expected default risk; however, once the credit crisis emerged, investors found that many of these vehicles did not perform as advertised.
Quantitative Tightening to Begin Next Month As widely expected, the Federal Reserve maintained the targeted federal-funds rate in a range of 1% to 1.25% and announced that it will initiate its balance sheet normalization program in October. The balance sheet reduction program will scale back the Fed's current re-investments to allow $10 billion of assets to roll-off per month and then increase the pace of reduction by an additional $10 billion per month every three months until it reaches a total monthly run-off rate of $50 billion (an annual run rate of $600 billion). Considering the total amount of assets currently held by the Federal Reserve banks is approximately $4.5 trillion, this is a very modest pace of reduction. Over the course of the next 12 months if the Fed increases the reduction each quarter, the total amount of reduction would be $350 billion. From there, the total amount of reduction by October 2018 would be just shy of $1 trillion. Depending on the amount of assets the Fed will want to retain on its balance sheet, the Fed will have let $2.75 trillion roll-off by October 2022, which would leave approximately $1.75 trillion.
More Market Outlooks
Stock Market Outlook: China Rebalancing Presents Winners and Losers
Basic Materials: Valuations Propped Up by Shaky China Fundamentals
Communication Services: Smaller Rivals Call the Shots in U.S. Wireless
Consumer Cyclical: Tepid Mall Traffic Could Constrain the All-Important Holiday Season
Consumer Defensive: Valuations More Reasonable After Third-Quarter Retreat
Energy: All Roads Point to Oversupply in 2018
Financial Services: Banks Can't Rest Easy
Healthcare: Stock Selection Key as Valuations Rise
Industrials: Worldwide Growth Is Resilient, But Valuations Look Full
Real Estate: Enter With Caution
Technology: Valuations Painting Overly Rosy Scenarios
Utilities: Valuations Still Running Out of Control
M&A Outlook: High Prices Impede Dealmaking in the U.S.
Private Equity Outlook: Larger Funds, Larger Deals
Venture Capital Outlook: Exits Come Into Focus as Valuations Continue to Climb
U.S. Stock Funds: Steady as She Goes
International-Stock Funds: The Beat Goes on
Bond Funds: A Period of Relative Calm
/cloudfront-us-east-1.images.arcpublishing.com/morningstar/G3DCA6SF2FAR5PKHPEXOIB6CWQ.jpg)
/cloudfront-us-east-1.images.arcpublishing.com/morningstar/6ZMXY4RCRNEADPDWYQVTTWALWM.jpg)
:quality(80)/s3.amazonaws.com/arc-authors/morningstar/54f9f69f-0232-435e-9557-5edc4b17c660.jpg)