
We Expect Compass Minerals to Bounce Back
Climate change is responsible for the firm’s weak recent results, but not how you might think.
/s3.amazonaws.com/arc-authors/morningstar/ca8d2ce1-cd0f-433b-a52b-d163be882398.jpg)
Salt Demand Should Rebound Intuitively, one might think Compass Minerals' deicing salt sales are tied to cumulative snowfall in its operating regions: More snow equals more salt. But a better predictor of salt sales is the number of days it snows at least 1 inch (which we will refer to as snow days). We found a highly predictive relationship (R-squared = 0.90) between Compass Minerals' deicing salt sales volume and total snow days in the company's 10 key metropolitan areas (which we will call Compass cities). This relationship was stronger than total amount of snow. Compass Minerals sells deicing salt throughout the Midwest and Great Lakes regions; however, given the strong statistical relationship, we based our analysis on the 10 Compass cities.
For Compass Minerals, typical deicing salt volume is likely to decline over time because of the effects of climate change. Nonetheless, long-term demand is likely to be considerably higher than depressed 2015 and 2016 volume. We expect Compass Minerals to sell 4% less salt in a normal winter 10 years from now, but 9% more than it did in 2016.
Our deicing salt volume forecast has two components: the total number of snow days per year in the 10 Compass cities and the amount of salt used per snow day.
Climate Change Will Lead to Fewer Snow Days, Gradually Climate change affects the number of snow days in three primary ways: increased weather volatility, more precipitation, and higher temperatures. We've found evidence of all three occurring in the Compass cities, although the effects are likely to occur over decades, not years.
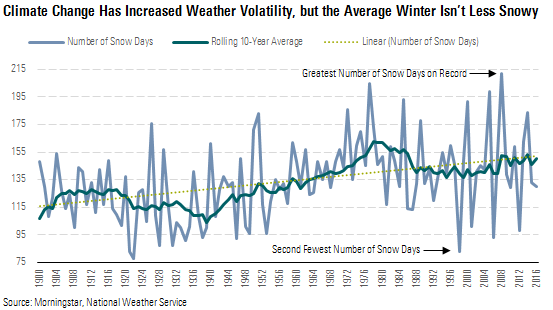
We looked at snow data from the National Weather Service for the 10 Compass cities since 1900. The number of snow days varies widely each year. Annual volatility has increased 30% since 2000, probably an effect of climate change. Over the past 20 years, the Compass cities have had both the greatest number of snow days and the second-fewest as any time in the past 120 years.
While annual volatility is high (and seems to be rising), there is strong reversion to the mean. The volatility is decreased by more than half when looking at a rolling 10-year average of snow days. The 10-year trailing average as of 2016 was 150 days, not much changed from 1976’s 152 days.
For deicing salt, this means annual demand fluctuations will probably vary considerably, but mean reversion is likely. While the winters of 2015-16 and 2016-17 had 10%-15% fewer snow days and subsequently lower deicing salt sales than average, we point to the rolling 10-year average as a better predictor of the likely number of snow days over the next few years.
According to the Environmental Protection Agency, greater precipitation is a climate change indicator in the United States. On both an annual and rolling 10-year average basis, total precipitation across Compass Minerals’ geographic footprint has generally increased since 1900.
If this climate change effect were taken in isolation, the result would be an increase in the average number of snow days and greater demand for deicing salt. But as climates concurrently shift north, greater precipitation will not translate directly into more snow days, as there will also be more rain in the winter months on days when the temperature is too warm for snow.
Climates Are Shifting North, Which Will Reduce Future Snowfall While it is harder to directly see climates shifting north than it is to see increased weather volatility and greater precipitation, we point to a greater number of days with a minimum temperature at or above 32 degrees in December, January, and February (which is how we define warm days) and northward movement of tree species as evidence that this trend is occurring.
Highway deicing salt demand is generally the greatest in December, January, and February, the three months each year with the most snow days. However, the number of warm days has risen over the past 50 years. If the minimum temperature is above freezing, there is little need for deicing salt (other than as a precaution) when it snows, as the snow will melt and road conditions are likely to mirror those of a spring rainstorm. While the increase in average “warm days” is relatively small in absolute terms (from 13 to 18), any additional days with a minimum temperature above freezing reduces salt demand.
Tree migration is further evidence of climates shifting north in Compass Minerals' operating region. A research paper published in the May 2017 Science Advances found 55% of tree species had shifted north over the past three decades. While the median speed of the shift was 20 kilometers per decade, some tree species moved over 60 km north in a decade. Because species migration appears to be accelerating, we incorporate a 40 km per decade climate shift into our forecast of average snow days.
To model the effects of a climate shifting north over the next 10 years, we looked at the number of snow days for 10 proxy cities that are an average of around 40 km south of the Compass cities. The proxy cities have an average of 4% fewer snow days each year. While the two have often moved together, the proxy cities have consistently had fewer snow days than the Compass cities.
We expect the “typical” number of snow days in Compass Minerals’ geographic footprint to fall 4% over the next 10 years, from 148 days to 142. Still, the typical winter 10 years from now is likely to bring more frequent snow than in 2015 and 2016, which saw very little (133 and 130 snow days, respectively).
We Expect the Quantity of Salt Used Per Snow Day to Remain Stable Compass Minerals has sold, on average, around 69,000 tons of salt for each day it snows in the 10 Compass cities. Historically, this number has varied inversely with the number of snow days each year.
There are likely two reasons behind this phenomenon. First, some municipalities pre-emptively salt roads in anticipation of a snowstorm that never happens, leading to greater salt usage per snow day in winters with unusually infrequent snow. Second, less salt is used when consecutive snow days occur as some salt will remain on the roads, leading to less salt usage per snow days in winters with unusually frequent snow.
When developing our forecast of salt sold per snow day, we see two trends, one positive and one negative, which will leave the average amount of salt used relatively unchanged over the next decade. The positive trend is infrastructure investment: More roads mean more salt per snow day. In the states that make up the majority of Compass Minerals’ territory, highway miles (on a lane mile basis) have grown at an average rate of 0.25% per year over the past 10 years. By itself, this continued trend would imply a slight increase in the amount of salt used every day it snows as more roads require more salt to be used.
However, salt trucks are becoming more efficient at salting the roads, which will offset the increase from new roads. New technology in salt trucks uses computers to determine how much salt to spread on a road. The computer will adjust the amount of salt put on the roads based on multiple factors such as outside air temperature, wind speed, temperature of the pavement, and speed of the truck. As this technology is adopted in more salt trucks, the amount of salt used per road mile will decline as the trucks distribute salt more efficiently.
Salt Prices Will Increase Modestly As a result of slightly lower demand combined with cost reductions in salt mines, we forecast deicing salt price increases to trail general inflation. For major commodities, we typically build a supply/demand model to forecast price changes; however, deicing salt has a series of regionalized markets because of its low value/weight ratio. As such, we look for industry demand and cost trends to guide our price forecast.
We expect nominal prices to rise a cumulative 16% over the next decade (1.5% per year). Given our expectation of 2.25% annual consumer price index inflation, this works out to a 7% cumulative decrease in real prices. Around half of the real price decline is attributable to reduced demand and the remainder is due to cost-cutting measures at salt mines, such as the introduction of continuous miners, a strategy that Compass Minerals is currently implementing. With lower costs to produce salt, we expect to see lower real deicing salt prices over time as the cost curve shifts down.
Compass Minerals' Profits Should Recover Strongly On average, Compass Minerals generates more than 75% of its revenue and operating profit from the salt business, with fertilizers contributing the remainder. Neither business has fared well in recent years. Salt segment EBITDA fell 26% from $336 million in 2014 to $247 million in 2016 as infrequent snowfall depressed volume and prices. Over the same interval, North American fertilizer EBITDA plunged by nearly half, from $102 million to $55 million, as price discipline cracked among the big global potash players, dragging benchmark muriate of potash prices from $297 per metric ton to $246. In total, Compass Minerals generated $266 million of EBITDA in 2016, down 32% from $389 million in 2014.
We think a bounceback in profits is highly likely, largely because our expectation that normal snow days will be far higher than seen in 2015 and 2016. We project consolidated EBITDA to grow over 70% during the next five years, although the comparison is somewhat inflated by the recent acquisition of Produquimica. Without the inclusion of Produquimica, we still forecast EBITDA to grow 56%.
The fortunes of Compass Minerals’ salt business have flipped in the past few years. As recently as 2014, the segment enjoyed record sales and operating profits, thanks largely to an unusually snowy winter. We estimate the number of snow days in the Compass cities that year was 24% above normal. Subsequently, the mild winters of 2015 and 2016 resulted in two consecutive years of falling sales and profits.
We project Compass Minerals’ salt segment to generate EBITDA of $355 million by 2021, up from a trough of $243 million in 2017. We see four tailwinds to salt segment profitability in the years to come.
First, as winter weather normalizes, deicing volume should rise. We expect Compass Minerals to sell about 10 million metric tons of deicing salt in a typical winter, up from roughly 9 million in the past couple of years.
Second, sagging deicing salt prices should recover amid a bounceback in demand. We forecast delivered prices of $59 per metric ton by 2021, up from $53 in 2017. However, prices are unlikely to return to prior highs in real, inflation-adjusted terms.
Third, average salt price realizations should improve amid a mix shift toward higher-priced consumer and industrial sales. These products, such as iodized salt used in food preparation or water softener tablets, are typically higher quality (than deicing salt) and in some cases must meet regulatory standards, which allow salt companies to charge a premium. These products also tend to have more stable demand. For example, food production typically grows with population. As we forecast consumer and industrial volume to increase slightly while deicing salt volume declines over the next decade, Compass Minerals’ sales mix will include a greater percentage of the premium products.
Fourth, salt production costs should fall. Compass Minerals is implementing a two-phase cost-reduction plan. The first phase involves a change in how salt is extracted from the Goderich mine: from traditional drill-and-blast techniques to using continuous miner machines. This should lower a variety of typical mining expenses, including fuel, maintenance, ventilation, and labor, as there will be fewer people needed to operate the machines. We estimate the change will result in a 20% cost reduction on a unit basis, which is roughly double what Compass Minerals’ competitors are likely to achieve with the same miners.
The second phase involves head count reductions at the corporate level and lower discretionary spending. This probably includes the consolidation of back-office and management positions related to the Produquimica acquisition. While management estimates the plan will generate around $20 million in annual expense savings, we are somewhat skeptical of discretionary spending reductions (which account for 40% of planned savings). As such, we assume only $12 million in associated cost reductions for the second phase.
The plant nutrition North America segment sells sulfate of potash and other specialty fertilizers such as the micronutrient blend Wolf Trax. The plant nutrition South America segment resulted from the Produquimica acquisition in the fourth quarter of 2016. It sells micronutrients for two primary uses: fertilizers and industrial chemicals. Fertilizer, which is a higher-margin business, makes up roughly 70% of segment sales.
Compass Minerals’ plan is to begin cross-selling its products in each continent. Compass Minerals will sell sulfate of potash in South America and offer Produquimica’s micronutrient blends to its North American customers. In the North America segment, Compass Minerals is expanding its sulfate of potash capacity. We expect the new customer bases will increase volume in both the plant nutrition North America and South America segments and drive profitability.
In North America, we expect falling prices to offset a portion of anticipated volume. Sulfate of potash prices, which account for the majority of Compass Minerals’ fertilizer sales, generally follow muriate of potash prices because lower-priced MOP is often used in the production of higher-priced SOP. In recent years, the relationship has broken down. MOP prices have fallen as low-cost players (Uralkali and Belaruskali) have chosen to expand capacity and pursue a volume-over-price strategy. SOP prices have also slipped, but to a far lesser extent, resulting in an unusually wide spread between SOP and MOP prices. We expect that spread to close as competitive forces drive SOP prices back to the marginal cost of production.
In the South America segment, the $46 million EBITDA increase from 2016 to 2017 is attributable to the inclusion of the Produquimica assets. In 2016, only the fourth quarter’s results were included in Compass Minerals’ consolidated earnings because of the timing of the transaction. The remaining growth will come from increased volume as Compass Minerals begins selling the new specialty fertilizer products in North America. A shrinking unit margin will partially offset the profit growth from volume as we project unit costs to outpace prices.
Geology and Geography Underpin Compass Minerals' Wide Moat The Goderich salt mine has unique geology that allows Compass Minerals to remove salt at a lower cost than its competitors. The mine's salt deposits have a higher grade of salt than the average mine and are 100 feet thick, compared with the average competing mine whose seams are only 20-30 feet thick. This allows Compass Minerals to use more-efficient mining techniques and remove more salt for each foot advanced in the mine. The higher-grade salt deposits also allow Compass Minerals to reduce costs by a greater proportion than its competitors when using the same new mining equipment (continuous miners) and techniques.
Compass Minerals also benefits from a geographical advantage. Both of its U.S. salt mines are next to waterways, which allows the company to transport salt at a lower cost. The Goderich mine’s location on Lake Huron allows Compass Minerals to economically transport salt greater distances throughout the Great Lakes region. The Cote Blanche mine’s location on the Mississippi River allows Compass Minerals to economically transport salt to many parts of the Midwest such as Minneapolis or Cincinnati via the Mississippi and Ohio rivers.
Management estimates that the ability to ship by water results in a total transportation cost of about half the cost of rail and one fifth the cost of trucking, which provides Compass Minerals with another source of its cost advantage. We agree with management’s estimates. We looked at total shipping capacity by water, rail, and truck, and the cost advantage makes sense. A single barge has the capacity of around 17 railcars, or approximately 55 tractor-trailers. When looking at fuel efficiency per 1 ton of cargo, a barge is by far the most cost-efficient, getting 514 miles per gallon versus 202 for a railcar and just 59 for a tractor-trailer.
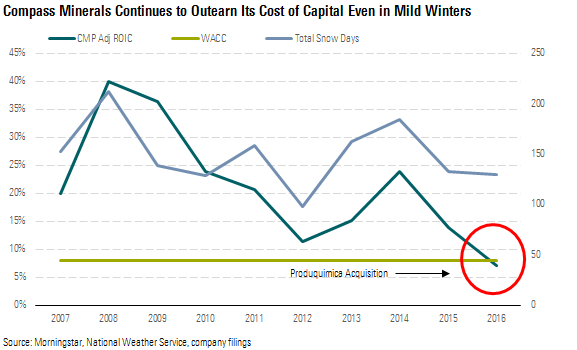
Compass Minerals’ cost advantage allows the company to generate returns above its cost of capital even in below-average winters with less snow. Compass Minerals has generated a return on invested capital above its weighted average cost of capital in nearly every year over the past decade. The only exception was 2016, when Compass Minerals acquired Produquimica, which greatly increased its capital base. While the ROIC tends to fluctuate based on the number of snow days, Compass Minerals has generated economic profits even in mild winters.
/cloudfront-us-east-1.images.arcpublishing.com/morningstar/TP6GAISC4JE65KVOI3YEE34HGU.jpg)
/cloudfront-us-east-1.images.arcpublishing.com/morningstar/RFJBWBYYTARXBNOTU6VL4VSE4Q.png)
/cloudfront-us-east-1.images.arcpublishing.com/morningstar/YQGRDUDPP5HGHPGKP7VCZ7EQ4E.jpg)
:quality(80)/s3.amazonaws.com/arc-authors/morningstar/ca8d2ce1-cd0f-433b-a52b-d163be882398.jpg)