
Active-Fund Investors Spread Their Bets
Data point to increasing diffusion of assets across active U.S. stock funds, which could theoretically make the market more efficient.
/s3.amazonaws.com/arc-authors/morningstar/fadee740-dfeb-494d-95b1-c462d0ac1f59.jpg)
The two decades-long explosion in index funds has been well documented. But lost in the shuffle is another somewhat surprising phenomenon—increasing diffusion of assets across funds.
In this article, we’ll review this change and what it might mean for market efficiency.
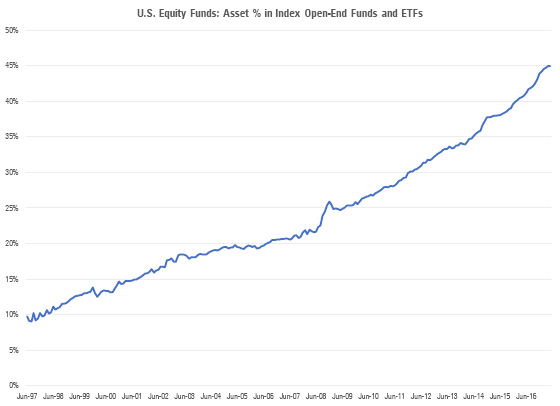
Explosion of Mutual Fund Assets There's no doubt that there's been a broad shift in equity assets from active to passive options. As of 1997, passive options accounted for 10% of total assets in funds in the U.S. equity mutual fund categories.
As of June 2017, passives stood at 45% of assets and their gains have accelerated in the past few years, as one can see from Figure 1 below.
While this shift of assets from active managers to passive managers has been unfolding, another development in the actively managed subset of the fund universe has not received much, if any, attention. It involves asset concentration. Our interest lies primarily in the fact that, potentially at least, changing levels of asset concentration may have implications for overall stock-market efficiency.
Have Investors Been Spreading Their Bets? Concentration is easy to grasp intuitively. In the context of assets under management, the more assets are controlled by a handful of funds, relative to the universe of all funds—or assets controlled by a few fund firms relative to all firms—the higher the asset concentration.
To measure that asset concentration, we’ve used the Herfindahl Index, whose advantages are threefold. First, the Herfindahl Index’s scale is easily understood. A Herfindahl index value of 1 means total concentration of the variable in question in one participant; a value of 0 (not really attainable) reflects perfect “diffusion”. Second, it is a relatively well-known, and broadly accepted, tool. The U.S. government uses it to gauge industry competitiveness when evaluating the effects of corporate mergers or takeovers. Third, it has a nice intuitive interpretation: It gives the probability that two randomly selected dollars came from the same source, whether it is a fund or a firm. (I’m using probability in the math notation, where 0 is 0% and 1 is 100%.)
Before we get to the results, a word about the data. We included all actively managed U.S. open-end funds whose broad U.S. category group is listed as either U.S. equity or sector equity; sector equity includes categories such as tech, utilities, REITs, and financials, among others. The U.S. equity category group is almost exclusively U.S.-focused; sector funds are predominantly so. We also included funds that are both live and funds that have merged or been liquidated over the past 20 years.
The Data Says Yes Now for the results. We calculated the Herfindahl Index monthly for assets in the active U.S. equity universe by both fund family and fund. We find that on both counts asset concentration has been declining, as one can see from Figures 2 and 3 below.
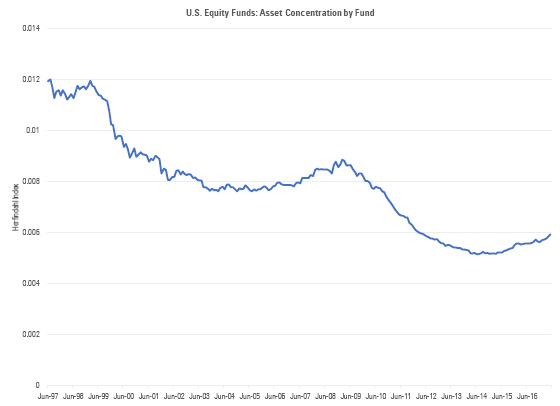
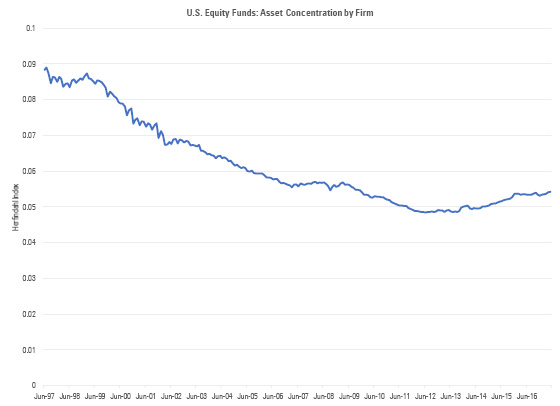
The charts show some wiggles in the pre-2004 period. That is, some smaller fund firms did not provide Morningstar with assets on a monthly basis until then. With this caveat in mind, it is remarkable that asset concentration has almost halved for both the fund and firm aggregations.
Why Are Investors Giving the Big Boys a Cold Shoulder? This certainly is an interesting development, but both its causes and implications are harder to evaluate.
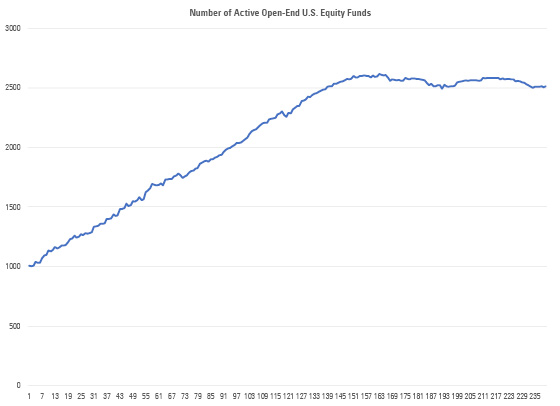
First, some of this effect may be due to the increased number of choices. Indeed, while the number of active funds (unique share classes) has plateaued since 2010, it has still risen to 2,500 from about 1,000 over the past 20 years. At the same time, the number of asset management firms appears to have roughly doubled over that time.
There is certainly reason to believe that more choices may have induced investors to diversify more widely, playing a role in the decreased asset concentration. However, this alone would not explain the discrepancy. The fact that more choices are available doesn’t mean that investors will necessarily avail themselves of them. But they did.
Secondly, investors appear to have become more diversified in terms of their category exposures. Among U.S. equity categories, a pronounced slide in asset concentration among categories started around the peak of the tech bubble in 2000 and the subsequent recession. Twenty years ago, about 80% of assets were invested in large-cap categories; this number is now down to 67%. In 1997, 38% of U.S. active funds’ assets were invested in the large-growth category. Large-growth’s share of assets is now down to a still-large 29% (for comparison, large-value’s share dropped to 21% from 23% over that time).
All in all, this makes sense given the carnage visited on high-growth funds when the tech bubble burst. The biggest beneficiaries of the shift were the small-cap categories, whose share of the investment pie more than doubled, to 10.31% from 4.75%.
Thirdly, it is possible that the decline in asset concentration among actively managed funds is itself related to the increasing share of assets that have flowed to passive options. It is tempting to speculate that the biggest funds were hit the hardest by investors who gave up on active management and transferred money to index funds. Indeed, of the 20 largest funds as of June 1997, all but one suffered cumulative outflows. (
One interpretation of this phenomenon would be that a big chunk of investors have decided that no one fund or firm has an obvious competitive advantage when it comes to active management, and so they, or their advisors, decided to spread assets more evenly among active managers.
Could the Mutual Fund Tail Be Wagging the Stock-Market Dog? If this hypothesis is correct, it would suggest that investors' actions may have actually made the markets more efficient. Theoretically at least, the more spread out active assets become, the more efficient one would expect the underlying stock markets to be. If one firm, or fund, controls a big chunk of the market's actively managed assets, it has a more heavily weighted "vote" in the market's collective decision on the correct price of a security. Furthermore, the more evenly the assets are spread out among market participants, the more independent their opinions should be, hence the more likely that the final price they agree on should be "correct".
Market efficiency is thus a compelling perspective from which to examine implications from the drop in fund and fund-family asset concentration. The fact that almost half of U.S. equity funds’ assets are now invested in funds that forswear stock-picking and just buy all stocks in bulk has some people worried: The less active management out there, the less informationally efficient the markets become. For those who share these worries, though, the results presented above may help allay those concerns. In other words, the decrease in asset concentration might actually be working in the opposite direction of the increase in passive-investment share.
To be clear—we’re not saying that the markets are becoming more efficient. A big chunk of new money is going to index funds and ETFs, perhaps reducing market efficiency. However, theoretically at least, reduced asset concentration among active managers should act as a factor helping to boost market efficiency. Whether that force would be strong enough to counter other forces, such as flows to passives and a further reduction in the number of individual investors holding stocks directly, is an open question. If—and it’s a big if—the reduced asset concentration is helping the markets to be more efficient, that would be bad news for active management. By definition, the more efficient the market, the harder it is to beat it, even for those managers who should happen to have market-beating skills.
/cloudfront-us-east-1.images.arcpublishing.com/morningstar/HDPMMDGUA5CUHI254MRUHYEFWU.png)
/cloudfront-us-east-1.images.arcpublishing.com/morningstar/OMVK3XQEVFDRHGPHSQPIBDENQE.jpg)
:quality(80)/s3.amazonaws.com/arc-authors/morningstar/fadee740-dfeb-494d-95b1-c462d0ac1f59.jpg)