
Economic Moats Matter: Here’s the Evidence
Seeking companies with competitive advantages and attractive valuations has led to smart investing.

By Michael Holt, Andrew Lane, and Hari Narayan
In a free-market economy, capital seeks the areas of highest return. Whenever a company develops a profitable product or service, it doesn’t take long before competitive forces drive down its economic profits. Only companies with an economic moat—a sustainable competitive advantage that allows a firm to earn above-average returns on capital over a long period of time—are able to hold competitors at bay.
Warren Buffett devised the economic moat concept. Morningstar has made it the foundation of its stock-investing philosophy and methodology. To us, buying a share of a stock means buying a small piece of a business, and successful investing involves a thorough evaluation of whether a business will stand the test of time.
A firm must have a competitive advantage inherent to its business to possess a moat. To help investors identify companies that have a moat, we assign one of three Morningstar Economic Moat Ratings: none, narrow, or wide. There are two major requirements for firms to earn either a narrow or wide rating: 1) The prospect of earning returns on invested capital above a company’s weighted average cost of capital, and 2) some competitive edge that prevents these returns from quickly deteriorating.
Moats stem from at least one of five sources of competitive advantage—cost advantage, intangible assets, switching costs, efficient scale, and network effect. Of the 200 or so wide-moat companies we cover, 72% benefit from intangible assets, 47% from sustainable cost advantage, 37% from customer switching costs, 20% from network effect, and 12% from efficient scale. (Because firms can achieve a wide moat from multiple sources, the percentages do not add up to 100%.) Great management, size, dominant market share, easily replicable technology or efficiencies, and hot products are advantages to any business, but none of them is a structural advantage that can sustain high returns over a long period of time.
Why Do Moats Matter? The concept of an economic moat plays a vital role not only in our qualitative assessment of a firm's long-term investment potential, but also in the actual calculation of our fair value estimates. A company that is likely to compound cash flow internally for many years is worth more today than a company that isn't. Therefore, when comparing two firms with similar growth rates, returns on capital, and reinvestment needs, the company with a moat has a higher intrinsic value.
High returns on capital will always diminish over time due to competition. For many companies (and their investors), economic profit erosion can be swift and painful. However, a few generate excess returns for many years, and moat analysis gives us a framework for identifying them.
Moreover, if a firm can fall back on a structural competitive advantage, it’s more likely to recover from temporary troubles. Moats provide a margin of safety because if an investor is confident in the moat, it’s easier to average down if he or she initiates a position too early.
Finally, the benefits conferred by a moat often are not fully factored into stock prices for several reasons. Most market participants own securities for short time periods, and moats matter much more in the long run than over shorter time periods. Also, recency bias causes most investors to assume that the current state of the world persists for longer than it usually does. Being patient and buying wide-moat stocks when they become cheap is a compelling investment strategy.
Wide-Moat Strategy in Practice How do we know? We now have evidence that investing in a portfolio of undervalued wide-moat stocks can earn a better-than-market return over the long term.
In 2007, Morningstar created the Wide Moat Focus Index based on the most undervalued wide-moat stocks in our coverage. To construct the index, we start with all U.S.-based and U.S.-traded companies to which we assign a wide moat rating (excluding master limited partnerships). We then select the cheapest stocks, as measured by the relationship of market price to Morningstar’s estimate of fair value. The index consists of two subportfolios, each holding 40 stocks. The number of holdings that make it into the index depends on how many stocks are replaced when each subportfolio is reconstituted. Typically, the index holds about 50 stocks. The staggered reconstitution allows the index to hunt for undervalued stocks more frequently than a traditional semiannual reconstitution. It also aims to reduce total portfolio turnover.
Our record demonstrates the benefit of investing in stocks of undervalued, high-quality businesses. From 2007 to the present, results are based on the index’s actual performance. Before 2007, Morningstar compiled hypothetical results going back to late 2002, when moat ratings were first assigned. Including these results, the Wide Moat Focus Index outperformed its Morningstar US Market Index benchmark by 4.5 percentage points annually (EXHIBIT 1).
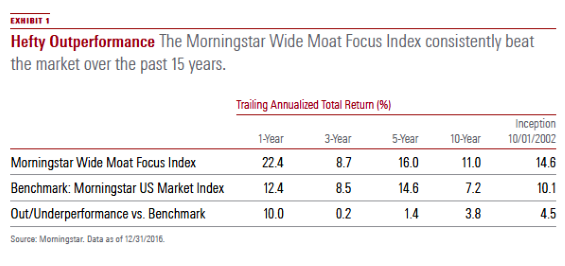
This period of outperformance encompassed a variety of market conditions, including boom and bust cycles in the commodity and housing markets. Since 2002, periods of underperformance by the index typically have been followed by periods of outperformance. This speaks to the fact that our process helps us identify situations where valuation has become dislocated from intrinsic value, allowing us to capitalize on mispricing. The Wide Moat Focus Index’s strong performance through several major market fluctuations highlights its disciplined and repeatable strategy.
On the other hand, the Morningstar Wide Moat Index, which is a passive portfolio of all U.S. stocks with a wide moat rating regardless of valuation, has trailed the Morningstar US Market Index more often than not annually. Since inception, it has earned an average annual return of 8.7% versus 10.1% for the benchmark. The Wide Moat Index has produced less volatility over this period, but the difference isn’t significant enough to compensate for lower returns. Sharpe and Sortino ratios for the Wide Moat Index are roughly in line with those of the Morningstar US Market Index. The Wide Moat Index provides an apples-to-apples comparison to the Wide Moat Focus Index, as all Wide Moat Focus Index holdings are included in the Wide Moat Index.
The significant difference between their relative long-term performance points to a core principle at Morningstar: Valuation is critical. Wide-moat stocks are often in favor when tumultuous market periods drive capital toward stalwart high-quality stocks. However, patiently buying quality firms at attractive prices is key to long-term investing success.
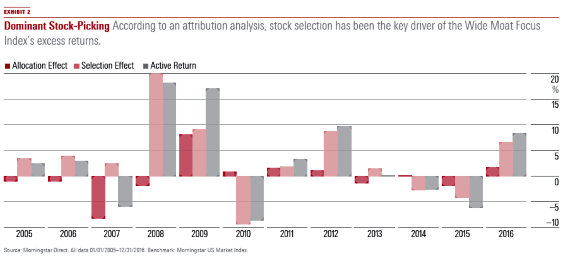
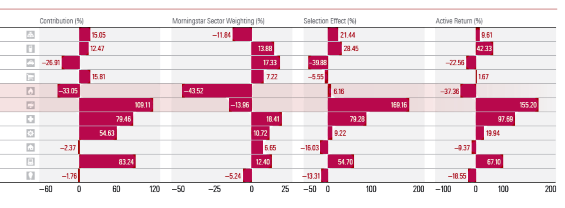
Security Selection Drives Alpha Attribution analysis highlights stock selection as the key driver of performance for the Wide Moat Focus Index (EXHIBIT 2). The allocation effect accounted for a very small part of the total active performance in most periods. The selection effect was dominant, accounting for more than 98% of excess returns. In other words, rather than relying on sector allocation to drive alpha, the strategy did an excellent job of including the right stocks within each sector.
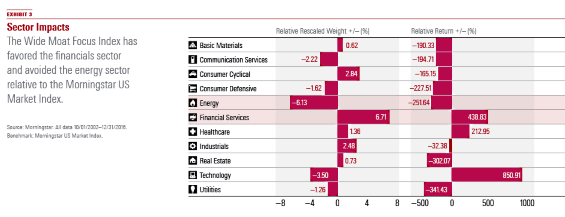
The detailed sector analysis in EXHIBIT 3 demonstrates that the Wide Moat Focus Index has historically favored the financials sector and avoided the energy sector relative to the Morningstar US Market Index. Simply put, sector tilt is a byproduct of our economic moat analysis and stock-picking, both bottom-up processes, and does not rely on a top-down overlay.
The Morningstar Sector Weighting category reflects the allocation effect by sector. Both the historical underweight in energy and overweight in financial services have driven a negative allocation effect. For the energy sector, a positive selection effect has served as a very slight offset. For the financials sector, however, a negative allocation effect has been far outweighed by a highly positive selection effect.
Recent Performance The Wide Moat Focus Index outperformed the Morningstar US Market Index benchmark by 10 percentage points in 2016, and more than 70% of this outperformance was driven by security selection.
The positive security selection effect in the overweighted consumer cyclical sector offset the negative allocation effect of not holding any communication services or utilities stocks by more than fivefold. Healthcare had the highest sector weighting in 2016, making up nearly one fourth of the index. Although healthcare stock selection provided a modest headwind to overall performance in 2016, the depressed valuations of our healthcare holdings have led us to increase our allocation to healthcare stocks in early 2017, patiently waiting for our investment theses to play out.
Risk-Return Characteristics The Wide Moat Focus Index provided more attractive risk-return characteristics than its benchmark, the Morningstar US Market Index, generating average annual returns of 14.6% since inception compared with 10.1% for the benchmark.
The Wide Moat Focus Index faced increased volatility relative to the benchmark, but the higher risk profile was well compensated, as demonstrated by higher Sharpe and Sortino ratios. The Wide Moat Focus Index has registered an information ratio of 0.52 since its October 2002 inception. A recent study that considers the performance of 230 actively managed U.S. large-cap equity funds over 10 years would place the Wide Moat Focus Index just outside the fifth percentile, which was defined at an information ratio of 0.54.1 Grinold and Kahn, who have published multiple studies evaluating active portfolio management, determined that top-quartile active equity fund managers generally have information ratios of 0.5 or higher.2 In a different study, Goodwin asserted that, over a 10-year period, very few long-only active managers have sustained an information ratio of 0.5 or higher.3
Upside and downside capture ratios also paint an attractive picture of relative performance during volatile markets. The Wide Moat Focus Index has risen 14% more when the benchmark is generally rising, yet it has fallen about 5% less when the benchmark is falling.
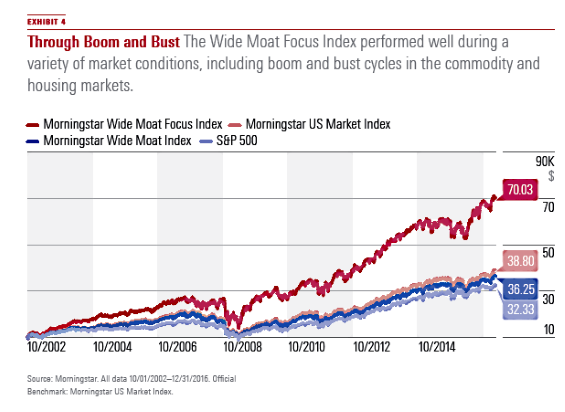
EXHIBIT 4 shows the strong performance of the Wide Moat Focus Index over time, comparing its total return with those of the Wide Moat Index, the Morningstar US Market Index, and the S&P 500. A hypothetical $10,000 investment in the Wide Moat Focus Index in October 2002 would have grown more than sevenfold by the end of 2016. The same investment in the S&P 500 or Morningstar US Market Index would have grown to less than $40,000.
Style Characteristics The Wide Moat Focus Index generally skewed toward large-cap stocks over the past decade, as our wide-moat stocks tended to have larger market caps. However, no significant style bias toward either value or growth is observed. More than 90% of the time, the index operated in the core section of the Morningstar Style Box.
Over the past decade, large-cap stocks typically accounted for most of the index holdings. Besides in early 2009, large-cap wide-moat stocks constituted the index’s main holdings. This is consistent with our coverage universe, as large-cap stocks account for roughly two thirds of the wide-moat stocks we cover.
The high concentration of large-cap stocks with wide moat ratings is attributable to a couple of key factors. First, two economic moat sources that we’ve identified—cost advantage and network effects—often benefit from companies with a large operational scale. Intangible assets, such as brands or patents, and high customer switching costs also tend to disproportionately accrue to larger firms.
Second, companies with economic moats tend to outlast and earn more compelling returns than competitors, leading to a survivorship bias across our coverage.
The Wide Moat Focus Index exhibited a slightly higher exposure to growth stocks than the Morningstar US Market Index. Over the past decade, the Wide Moat Focus Index had a 36% weighting to stocks in the growth category and a 31% weighting to stocks in the value category. Since inception across the broader market, value has slightly outperformed growth, so the index overweight toward growth stocks likely provided a modest headwind for performance.
The overweight to large- and mid-cap stocks is also relatively modest. The Wide Moat Focus Index has been roughly 3% overweight large- and mid-cap stocks, on average, relative to the US Market Index since inception. This size bias might have provided a slight headwind to performance, but again, security selection was the overwhelmingly dominant driver of outperformance, as our attribution analysis shows.
A Powerful Combination The Morningstar Wide Moat Focus Index is a portfolio of our cheapest wide-moat stocks relative to fair value. It has generated excess long-term returns versus the overall market. The strategy has also outperformed most large-cap and mid-cap mutual funds. The index generated alpha through volatile market conditions over the past decade thanks to its disciplined and repeatable strategy. Periods of underperformance typically preceded periods of outperformance as the portfolio waits for out-of-favor companies with durable competitive advantages to revert toward fair value.
Performance attribution shows that security selection has driven more than 98% of excess returns for the Wide Moat Focus Index, with the balance explained by style and sector tilts. Our moat methodology and bottom-up approach to valuation have proved to be a powerful combination, allowing for solid stock selection results through market cycles.
Michael Holt, CFA, is head of global equity research with Morningstar Research Services. He is a member of the editorial board of Morningstar magazine.
Andrew Lane is a senior equity analyst with Morningstar Research Services. He is chairman of Morningstar’s economic moat committee.
Hari Narayan is an associate equity analyst with Morningstar Research Services.
1 Zephyr Associates, Inc. (2013). Zephyr StatFACTS: Information Ratio. 2 Grinold, Richard C., and Ronald N. Kahn (2000). Active Portfolio Management. 3 Goodwin, Thomas H. (2009). The Information Ratio.
This article originally appeared in the August/September 2017 issue of Morningstar magazine.
The author or authors do not own shares in any securities mentioned in this article. Find out about Morningstar’s editorial policies.
:quality(80)/cloudfront-us-east-1.images.arcpublishing.com/morningstar/MFL6LHZXFVFYFOAVQBMECBG6RM.png)
:quality(80)/cloudfront-us-east-1.images.arcpublishing.com/morningstar/HCVXKY35QNVZ4AHAWI2N4JWONA.png)
:quality(80)/cloudfront-us-east-1.images.arcpublishing.com/morningstar/EGA35LGTJFBVTDK3OCMQCHW7XQ.png)