
Not All Moats Are Created Equal
Some sources of moats are more potent than others.
/s3.amazonaws.com/arc-authors/morningstar/7101adb1-5ca1-4d1d-ba1f-e49c0e2269df.jpg)
/s3.amazonaws.com/arc-authors/morningstar/a0c4f3f6-4dd6-44dc-b929-6cb8f8a60850.jpg)
When assigning economic moat ratings, Morningstar analysts and the Morningstar economic moat committee take both quantitative and qualitative considerations into account.
On the quantitative side, we look to the spread between forecast returns on invested capital and our assumed weighted average cost of capital, which represents economic profit generation. Per our methodology, the durability of economic profits is far more important than magnitude. Additionally, clear evidence must exist that the company benefits from at least one of five moat sources: intangible assets, cost advantage, switching costs, network effect, and efficient scale.
In this article, we analyze various financial metrics across different moat ratings and moat sources to better substantiate the fundamental performance that investors should expect when investing across the cohorts we define. Our findings indicate that not all moats are created equal; certain moat characteristics consistently lead to more attractive financial performance than others.
Our Method In conducting our analysis, we included our entire coverage universe after eliminating duplicate share classes. We counted companies with ADRs only once. This ensures that each company receives an equal weighting in our calculations.
After we categorized our entire coverage universe of wide-, narrow-, and no-moat stocks, we then divided companies into different cohorts, sorted by their sources of competitive advantage. We compared various financial metrics across these cohorts to better understand the fundamental characteristics investors should expect to see across the classifications that we use.
We were forced to make one major assumption in performing this analysis. When assigning companies to cohorts based on moat rating and moat source, we employ a static approach. In other words, for time-series data, we treat each company as though it has always existed in the cohort to which it is currently assigned. For the vast majority of companies, this assumption is not problematic. However, some companies have moved between different moat rating and moat source buckets over time. Historical data for these companies is considered only in the context of their current classifications.
All data used in this analysis was derived from Morningstar Direct and pulled on May 16. To minimize the effect of outliers, we used medians whenever possible. Here are our findings:
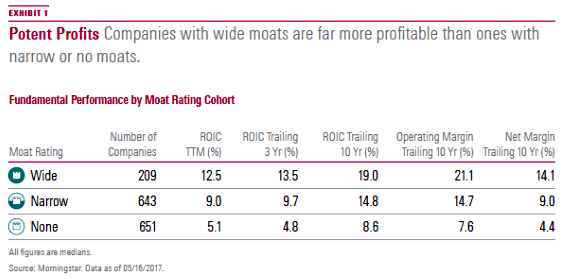
Wide-Moat Firms Are Far More Profitable Than Narrow- and No-Moat Firms This conclusion comes as no surprise, given that a company's return on invested capital is the primary form of quantitative evidence we consider when assigning an economic moat rating in the first place. However, in observing the metrics associated with each moat rating cohort, the data in EXHIBIT 1 is useful in quantifying the potency of each moat rating.
Wide-Moat Firms Are More Likely to Benefit From Multiple Moat Sources Than Narrow- Moat Firms Again, this is an intuitive result, as a higher number of moat sources should lead to more-sustainable economic profits. Our research indicates that 75% of wide-moat firms derive their competitive advantage from more than one moat source, compared with just 60% of narrow-moat firms.
The most frequent moat source combination is intangible assets and switching costs (179 companies), followed closely by intangible assets and cost advantage (167 companies). The combination of network effect and efficient scale is the least common by a wide margin (19 companies).
When multiple moat sources might apply to a given business model, each moat source must be examined on its own merits. Although sources of competitive advantage are linked in many instances, the litmus test we use in considering each moat source that might apply is the following: Would the company still have an economic moat if this were the singular moat source at play? For example,
Firms That Benefit From Multiple Moat Sources Exhibit Better Fundamental Performance Than Those With Only One Moat Source. This finding is intuitive as well. The more barriers to entry a company enjoys, the lower the risk that its competitive positioning will deteriorate and the more sustainable its profitability.
We then performed the same analysis across each of the wide- and narrow-moat cohorts to control for moat rating mix.
For wide-moat companies with multiple moat sources versus just one, returns on invested capital have been higher in recent years, but both trailing 12-month and trailing 10-year term returns on equity have actually been lower. This represents a change from the findings in our 2012 iteration of this report, which indicated that wide-moat firms with multiple moat sources had delivered better fundamental performance across all four metrics. More often than not, we’d expect firms with multiple moat sources to report higher profitability than those with only one moat source.
For narrow-moat companies, however, we observe more typical results, with both returns on invested capital and returns on equity modestly higher for companies with two or more moat sources than those with only one moat source.
Across the Five Moat Sources, Efficient Scale Is the Most Likely to Drive a Narrow Moat Rating. Network Effect Is the Most Likely to Drive a Wide Moat Rating. When efficient scale is cited as a moat source, the associated company has been assigned a narrow moat rating 88% of the time. To explain this dynamic, given that returns on invested capital for efficient-scale companies tend to be only modestly above capital costs, it is difficult to establish a high degree of conviction that a company we expect to generate minimal economic profit 10 years from now will be able to replicate that performance over the subsequent 10 years. When economic profit spreads are thin, any number of exogenous factors, such as market size fluctuations, a changing regulatory landscape, or changing consumption patterns, could derail economic profit generation over a longer time horizon.
Network effect leads to a wide moat rating for 37% of the companies to which it is applied, a higher frequency in percentage terms than any other moat source. This makes intuitive sense. When a company establishes the network effect, it can often be a winner-take-all situation, providing the leading firm with a wide moat while leaving competitors with no moat at all. Consider the early days of social media when
Network Effect Drives Better Fundamental Performance Than Other Moat Sources Across Nearly Every Metric Examined. As reflected in EXHIBIT 2, among the five potential moat sources, the cohort of companies that derive their competitive advantage from network effect has posted the highest profitability across every metric except trailing three-year returns on invested capital. This outcome reflects the fact that although network effect is the least common moat source, it is very powerful once established.
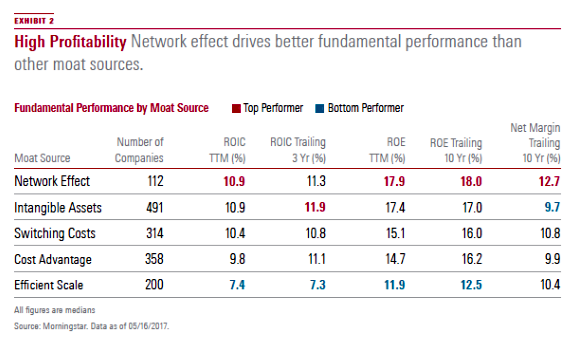
Companies that benefit from efficient scale have had the least favorable fundamental performance across nearly all metrics and measurement periods. This probably reflects the fact that regulated utilities commonly enjoy efficient scale but have their returns on invested capital capped by regulatory bodies to shift would-be economic profits into consumer surplus.
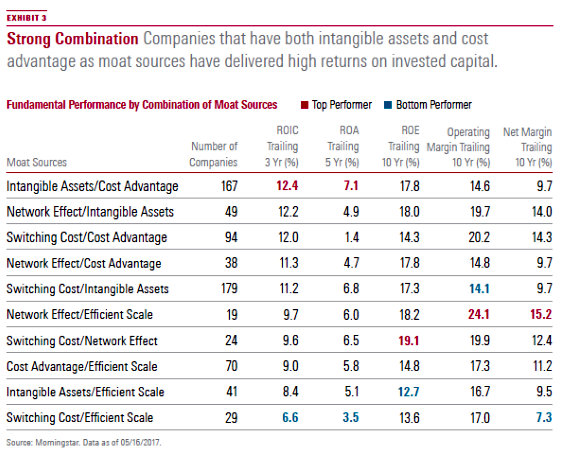
The Combination of Intangible Assets and Cost Advantage Has Delivered Higher Returns on Invested Capital Than Any Other Moat Source Combination.
We looked at all the possible combinations of economic moat sources to analyze relative potency. As reflected in EXHIBIT 3, the companies with the combination of intangible assets and cost advantage provide the highest returns on invested capital. This cohort includes companies such as
We also looked at equity total returns by moat source combination (EXHIBIT 4). We discovered that the efficient-scale moat source has a polarizing effect. Over the past five years, efficient-scale firms that also benefit from intangible assets delivered very high total returns. However, efficient-scale firms that also enjoy cost advantage delivered the lowest total returns. The cohort with the highest total returns (intangible assets and efficient scale) includes companies such as
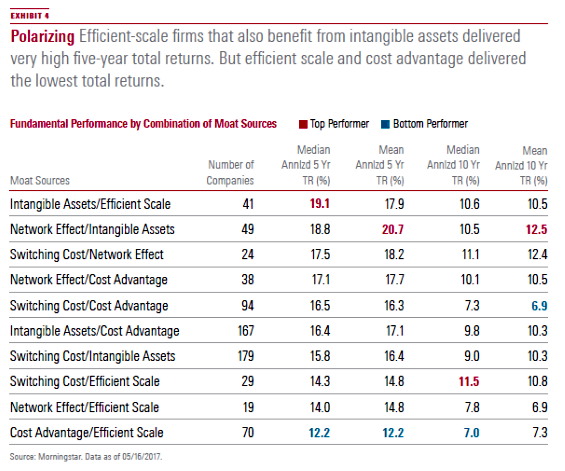
Combinations involving network effect generally performed well, ranking second, third, and fourth (as well as ninth) on trailing five-year total returns (with the ninth-place cohort representing the smallest sample size of any combination). Network effect and intangible assets performed the best in combination. This group includes companies such as Facebook,
We did not look at companies with three or more combinations because the cohorts are too small to draw meaningful conclusions. Only 74 companies in our coverage universe source their moat from three or more advantages.
Network Effect Drives the Highest Earnings Volatility. In looking at the stability of earnings through time, we took a 10-year time series of the median return on equity, return on assets, and operating margin for each moat source cohort and measured the associated standard deviation over those 10 years. The network effect had the highest variability across all three metrics.
We took this analysis one step further by breaking down each of the five sources of moat into wide- and narrow-moat cohorts. Wide-moat companies with switching costs had the most stable returns on equity, narrow-moat companies with efficient scale had by far the most stable returns on assets, and wide-moat companies with cost advantage had the most stable operating margins. Conversely, narrow-moat companies with network effect had the least stable returns on equity, wide-moat companies with network effect had the least stable returns on assets, and narrow-moat companies with network effect had the least stable operating margins.
We also divided each profitability metric by its associated standard deviation to create a risk-adjusted index for each metric. For each risk-adjusted profitability metric, wide-moat companies stand out as top performers across each moat source. However, within the wide-moat cohort, companies with network effect performed the worst. For these companies, although profitability is high, they are also subject to elevated risk.
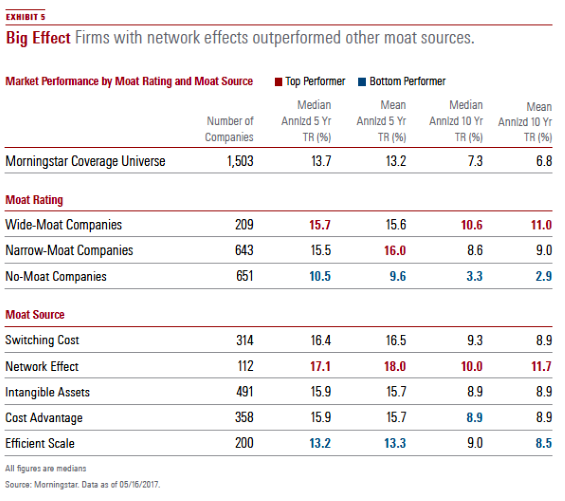
Network-Effect Firms Have Delivered the Best Market Performance on a Total-Return Basis. Over the trailing five and 10 years, network-effect firms have outperformed other moat source cohorts on a total-return basis, with efficient-scale companies bringing up the rear (EXHIBIT 5). We'd anticipate these findings to change over time depending on the performance of growth stocks versus value stocks. The constituents of the network-effect bucket lean toward growth characteristics, while the constituents of the efficient-scale bucket lean toward value characteristics. When we conducted this analysis in 2012, efficient-scale stocks had delivered the best trailing total returns, and network-effect stocks delivered the second-lowest.
Additional Conclusions Moving beyond profitability and total-return measures, we looked at other metrics not related to fundamental or market performance.
We observe that wide-moat firms trade at the highest price/earnings ratios, are the least shorted, have the highest market caps, and offer the lowest dividend yields. Narrow-moat firms offer the highest growth. No-moat firms trade at the lowest P/E, offer the lowest growth, are the most shorted, have the lowest market caps, and offer the highest dividend yields.
Switching-cost firms trade at the lowest trailing five-year P/E. Network-effect firms trade at the highest trailing and current P/E (by far), exhibit the highest growth, and have the lowest dividend yields. Intangible-assets firms do not finish first or last on any metric. Cost-advantage firms have the highest market caps and are the least shorted. Efficient-scale firms trade at the lowest current P/E, have the lowest growth, are the most shorted, have the lowest market caps, and offer the highest dividend yields.
Sources and Outcomes We have identified the sources of competitive advantage for every company with a narrow or wide economic moat rating. Each of these companies sources its moat from one or more of these categories: intangible assets, cost advantage, switching costs, network effect, or efficient scale. In this article, we took our qualitative assessments of competitive advantage regarding these sources and tied them to quantitative measures of performance for several different large and diversified cohorts.
We found some striking differences in cohorts defined by the source of competitive advantage. For example, network effect is the most likely to drive a wide moat rating, while efficient scale most likely drives a narrow moat rating. Network effect also drives better fundamental performance than other moat sources across nearly every metric examined. Meanwhile, the combination of intangible assets and cost advantage has delivered higher returns on invested capital than any other moat-source combination. This analysis shows that, although it is a strong benefit for companies to hold competitive advantages over peers, certain moat sources lead to better financial performance than others.
This article originally appeared in the August/September 2017 issue of Morningstar magazine.
The author or authors do not own shares in any securities mentioned in this article. Find out about Morningstar’s editorial policies.
/cloudfront-us-east-1.images.arcpublishing.com/morningstar/MFL6LHZXFVFYFOAVQBMECBG6RM.png)
/cloudfront-us-east-1.images.arcpublishing.com/morningstar/HCVXKY35QNVZ4AHAWI2N4JWONA.png)
/cloudfront-us-east-1.images.arcpublishing.com/morningstar/EGA35LGTJFBVTDK3OCMQCHW7XQ.png)
:quality(80)/s3.amazonaws.com/arc-authors/morningstar/7101adb1-5ca1-4d1d-ba1f-e49c0e2269df.jpg)
:quality(80)/s3.amazonaws.com/arc-authors/morningstar/a0c4f3f6-4dd6-44dc-b929-6cb8f8a60850.jpg)