
Is Low Inflation a Quirk or a Trend?
There are signs that both transitory issues and long-term headwinds are conspiring to keep price levels below the Fed’s target for now, but higher inflation is still a possibility.

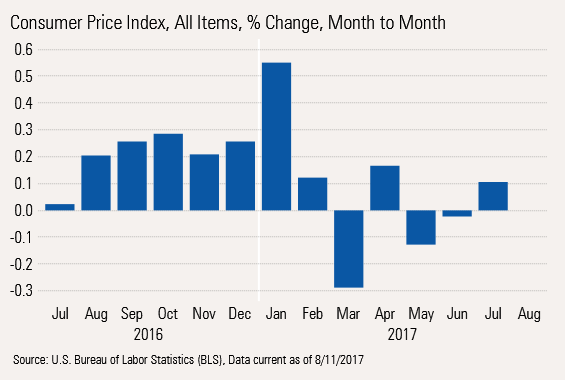
About the only economic news of real consequence this week was Friday's inflation report, which showed surprisingly low inflation for the month of July on both a month-to-month and year-over-year basis. The month-to-month inflation rate was just 0.1% (1.2% annualized) while year-over-year inflation was 1.7%. Both numbers were below expectations of 0.2% and 1.8%, respectively. Inflation has now been below expectations for six months in a row, suggesting issues in the Fed's efforts to raise inflation rates closer to 2%. Most of our report will suggest both a short-term and longer-term outlook for inflation.
Data on productivity hinted that the poor efficiency numbers of late 2016 are now looking substantially better, moving from negative productivity growth to 1.2% for second-quarter 2017. Nevertheless, that number is still well below the 2.1% longer-term rate. However, a more careful review of long-term data suggests that the average overstates the real rate of past productivity growth. In other news, data from the National Federation of Independent Business suggested that concerns about finding workers have reached a new recovery high. Meanwhile, the Job Openings and Labor Turnover report showed that job openings topped 6 million and are now at an all-time high. These two data points as well as last week's labor report and ongoing initial unemployment claims data suggest that worker shortages are quickly becoming a much bigger issue than job availability.
Quirky Inflation Data or Lower Price Levels The inflation report again undershot expectations with month-to-month total inflation up only 0.1% versus expectations of 0.2%, which annualized to a mere 1.2%. The annualized month-to-month inflation rate has been under the Fed's 2% target for five consecutive months. There have been a lot of odd quirks that have pressured inflation rates in the monthly data since March--to be discussed later--but it seems that all of these quirks wouldn't keep popping up each month if inflation were really marching toward the 2% target. That said, based on what we already know about gasoline prices and what we surmise will happen with food and a couple of other categories, we suspect that inflation in August and September could be up in the 0.3% or 3.6% range. So I am not panicked about deflation, at least not yet.
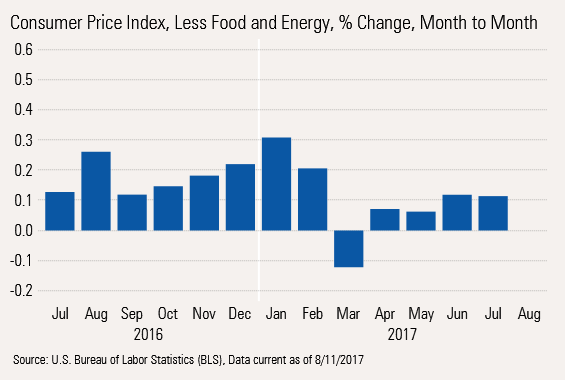
Abnormally Low Inflation Is Not All About Food and Energy, Either The inflation picture looks less volatile, but is still running at about two thirds of target if we exclude food and energy. We don't like this measure most of the time because those sectors make up such a large percentage of consumer spending. However, the Fed likes to look at this so-called core inflation rate, as shown below:
Even the Year-Over-Year, Averaged Data Shows Low Inflation Rates
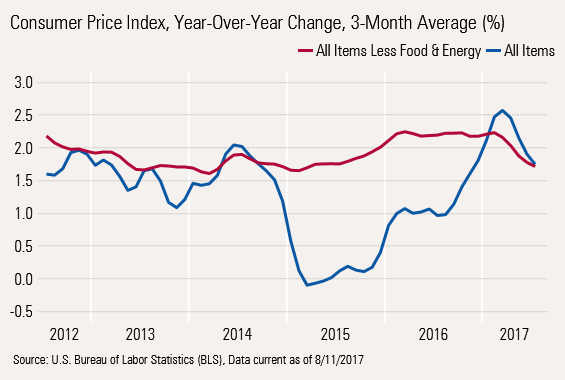
We spent months worrying about the fading impact of falling gasoline prices on headline inflation (the rate that customers actually experience), eventually raising it to look like the core rate of about 2%. Indeed, headline inflation shot past core inflation rates in February and March, potentially explaining some of the soft retail sales numbers of this spring. Now core and headline inflation have dropped back to 1.7%. That's good news for workers, who now see their raises going further.
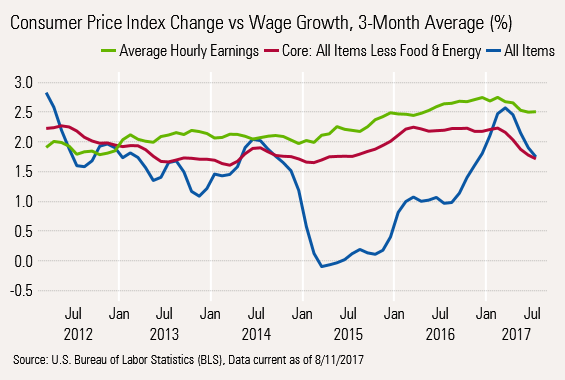
Recent Gasoline Price Increases Could Temporarily Move Above 2%, Still Below Likely Wage Growth While inflation rates outside of gasoline have been extremely stable, gasoline has added a lot of volatility to even the year-over-year averaged data. The year-over-year inflation rate excluding gasoline was mostly in the 1.7%-2.0% range over the past year, before dipping to 1.6% for the most recent three-month period.
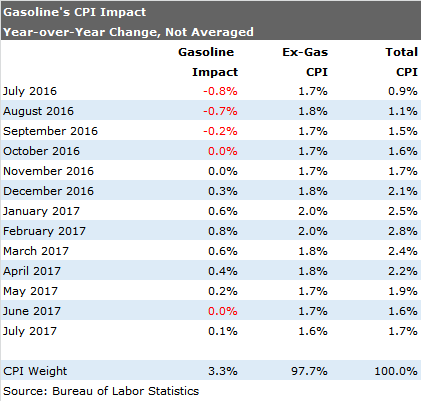
However, we suspect that year-over-year inflation will pick up again. Gasoline prices are up a bunch year over year, at least through April, and could remain elevated at least through mid-September, boosting the gasoline component significantly. We have enough data to be relatively sure about gasoline inflation in August and to make a decent guess at September. After that, we assume that prices revert to their seasonally adjusted 12-month average. We are assuming the central tendency of other inflation is about 1.9%. Food and cellphone service pricing have temporarily deflated the number a bit. With food prices on the rise again this month and the cellphone impact eventually burning off, our best inflation guess appears below:
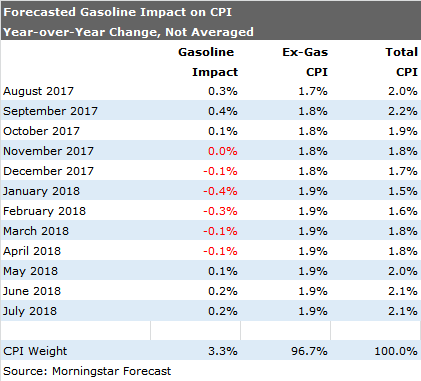
So without any more quirks, inflation could hit the Fed's 2% target in October, on a single-month basis. However, given the mechanics of gasoline pricing, inflation could dip back to 1.5% by January and then increase back to 2% or so. Of course, the caveat is that this forecast assumes relatively stable gasoline prices and no more quirks.
Quirks Keep Thwarting Inflation Bulls Most economists, including us, had assumed that inflation would be quite a bit higher by now, perhaps up in the 2.5%-3% range instead of 1.6% rate we saw in July. We currently aren't even expecting that headline inflation to get back over 2% until May. All of this began innocently enough. First, a bumper crop and large grain price declines since 2014 finally rolled through the entire food supply, starting with grains and chicken and ending with outright declines in beef prices in 2016. That helped year-over-year food fall for six consecutive months ended in February. Although prices are on the rise again, they really anchored the inflation rate for many months. While food inflation rates are incredibly volatile, over long periods of time food prices look quite similar to core inflation rates.
Then, modest used car price declines in early 2016 turned into a relative free-fall in 2017 as a flood of cars came of leases depressing prices. Used prices are now down 4.2% year over year. So even though used cars make up just 2% of the CPI, it has taken almost 0.1% of off the 1.6% total inflation rate. Competition from used cars combined with automaker overproduction now has even new car prices going in reverse. New car prices are down 0.6% year over year. In my opinion, the rates of decline are not likely to reverse and could even worsen over the next several years. The auto sector inflation plunge is likely the real deal and not a one-off event as many others are contending.
And then there were cellphone service plan changes in March (to more or less unlimited data plans, for the same price, which is a price reduction, according to the BLS). This seemed to have a big one-time impact as most carriers adapted similar plans around the same time. However, we are bit surprised that cellular phone service and data plans are continuing to see month-to-month price declines, this time 0.3% (3.6% annualized) for July. This pushed year-over-year price declines up to an astounding 13.4%. Even at just 1.6% of the CPI, this large a decline took a full 0.2% off the reported 1.6% inflation rate.
This month's quirk is that hotel room prices reportedly declined by 4.2% in a single month and 2.4% year over year. This price change seems to qualify as a potentially reversible quirk. With airline prices up and interest in travel generally high such a large one-month decline seems a bit odd. We note, though, that hotel prices are now down for two months in a row.
We could probably find a couple of other downside quirks (why are healthcare services only growing at 2.3% when wage inflation alone in this sector is running over 2.5%?) And many economists, including Fed Chair Janet Yellen, are rushing to use these "quirks" to explain the below-target inflation rates. If it were just one or two items they could be a plausible explanation. With new quirks popping up each month, we aren't so quick to dismiss all of them as special. Instead, it suggests to us that inflation remains relatively tame and that the inflation we are seeing is more sector-specific supply and demand issues rather than broad inflation with the pricing of everything going up at the same time.
Plus, the economy wasn't without items where the economy had higher prices. Prescription drug prices up 4% year over year seems a bit high to us. Apparel prices are back on the rise now, perhaps because weather has been seasonable and the dollar has declined for the largely imported, which has seen prices move higher as the dollar weakens. Shelter prices continue to move higher, too, with shortage persisting in some but not all areas. It was nice to see rents drop back to 0.2% month to month, though. That number had been stuck at 0.3% for some time.
By very broad categories of spending, including both services and goods components, it is a picture that shows some considerable balance with some declines, some modest increases, and just a few with large increases.
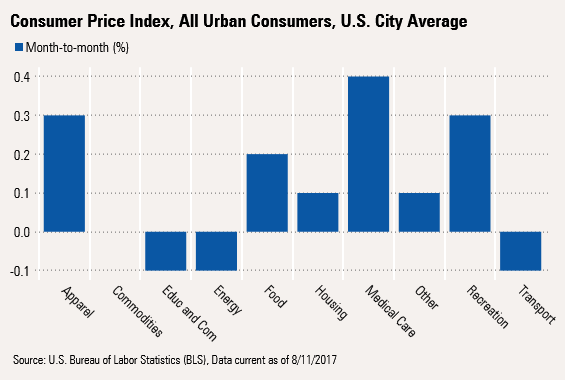
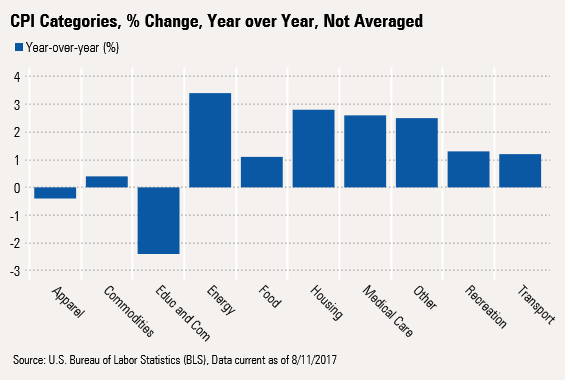
The year-over-year data shows a bit more uniformity. The month-to-month data also suggests that some categories may have reversed longer-term trends. Apparel prices are moving back up after some hefty declines. Energy prices after a spike look to be in the process of stabilizing; food is moving back up.
Longer-Term, There Are Some Pluses and Minuses on the Inflation Rate Potentially keeping inflation low are demographic factors. An aging population tends to buy fewer things and less food, potentially keeping a lid on the demand side for goods. However, services inflation, especially healthcare, could pressure inflation on the upside. Offsetting that, retirees, especially younger, more mobile retirees, tend to have more time to comparison shop, potentially providing another governor on prices. And suddenly new retirees may find money more valuable than time. While I am certainly not claiming any direct relationship, inflation peaked in 2008, about the same time the first baby boomer retired and has been surprisingly tame ever since. I also think the shale boom and conversion of many energy-related systems as well as greater energy efficiency (think LED bulbs, increasing auto fuel efficiency) may pressure energy prices downward for some time. Fiscal spending on the state and local levels of government also remains under extremely tight control.
Not meaning to sound too much like a real economist, but there are real potential inflation boosters. At the moment, my bigger long-term worry is that government data on output potential suggests that more inflation might be at hand. The Congressional Budget Office suggested that the economy's full employment, full capacity output level was about $17.1 trillion for the second quarter and the actual output was about 17.0 trillion, or very close to full production. That gap is closing quickly, and should close completely by year-end, if our current growth forecast is correct. When actual production punches through potential output, a bout of meaningful inflation often ensues. The track record for this metric is nearly perfect in the post-World War II era. Lower growth for the second half, induced by poor auto sales, could upend the inflation signal, as could improving labor market participation rates. Balancing everything out, over the next five to 10 years, we believe that inflation will likely end up in the 2.0%-2.5% range, higher than the current 1.6%, but certainly not a 1970s-like inflation free-fall when demographics, fiscal and monetary policies, output constraints, and commodity inflation all conspired to push inflation up and over a 15% rate.
Productivity News Better, but Not Wonderful We have generally been a tad more negative on GDP growth than the consensus for some time. We started the year worrying that higher inflation and lower real wage growth would likely keep a lid on GDP growth in 2017, despite the potential for improved business investment and a smaller hit from inventory reductions. Our original forecast for 2017 was for 1.75%-2.0% growth, while the consensus was in the 2.25%-2.5% range. We have maintained our forecast while the consensus estimate has moved down to closer to 2%. To be honest, this has generally been the case in most years since the recession. Hopes are almost always too high at the beginning of the year and then falter by the end of the first quarter. Sometimes, by midyear, our GDP estimates looked high compared with the consensus forecast, which was typically an overreaction by the majority to weak first-quarter performance.
Until the last year or so we had called the U.S. economy an ocean-liner economy because it was exceptionally difficult for growth to change direction or even change speed by much. Annual GDP growth was typically in the 1.5%-2.5% range for most of this recovery with an average of 2.1%, below the 60-year average of 3.1%. However, this has been an unusually long recovery. Demographics and slower productivity have combined to keep GDP growth lower than normal. The growth in the working-age population has dropped to a crawl as baby boomers retire in droves. Productivity growth has been part of the issue, too. We have focused extensively on population growth in the past, deferring discussions of productivity because of the complexity of the issue.
Recently Revised Productivity Numbers Are Better, but Still no Prize Relative to History This week's release of official productivity numbers for the second quarter presents an opportunity to discuss the issues and problems with productivity measurement. The long-term history of productivity is shown below:
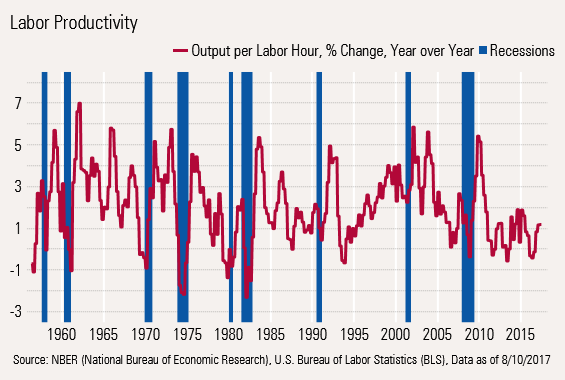
Productivity Has Looked Lethargic Lately The first observation that most are very quick to make is that after the typical post-recession jump, productivity growth looks quite lethargic. In general we agree that productivity growth doesn't seem to be up to its usual standards. Long-term averages seem to show productivity growth of about 2% and the most recent quarterly data shows year-over-year productivity growth of 1.2%.
Economists Can't Agree on the Cause of Slowing Productivity We have read convincing articles claiming it is a younger workforce (as a result of baby boomer retirements) that is paid less and is less productive. Others claim, equally forcefully, that greater regulation and compliance enforcement are behind the slowdown. A shift to more service-oriented businesses, which have more productivity, may also be at work. Finally, the fact that individual sectors are performing so differently isn't helping matters, either. Industries that are growing slowly or shrinking tend to have the worst productivity numbers (employers are slow to lay off workers). Meanwhile, a lot of rapidly growing industries can't hire workers fast enough, forcing those who are there to work harder. This recovery has been characterized by the uneven nature of sector performance. If all industries were growing at the same pace, or at least close to each other, this would not be a major concern.
Strong Productivity Performance During and Immediately After the Recession Makes More Gains Difficult I might argue that maybe the overall performance since 2011 isn't quite as bad as it seems. First, the productivity held up incredibly well in the Great Recession. In the heat of the recession, a lot of laws were changed to give businesses more flexibility to trim labor. Auto franchise rules are just one example (which were changed in bankruptcy courts). Despite the smaller-than-normal early recession drop, the immediate post-recession was every bit as strong as usual. That combination of a mild recession dip and normal boom made it difficult to eke out more gains later in the current recovery.
Productivity: Nothing More Than an Indicator of Where the Economy Is in the Economic Cycle Single-year productivity data is pretty close to worthless. Productivity collapses in a recession as businesses can't lay off workers fast enough. However, by mid-recession, businesses make the necessary labor cuts, causing productivity to bottom out. Then, when recovery begins, businesses are reluctant to hire new workers after just completing all those layoffs. And those who still have jobs are working extra hard to make sure they aren't the next layoff candidates. Those post-recession spikes are massive, and seldom matched for the rest of the recovery.
Looking at 10-Year Data Sets Helps Somewhat
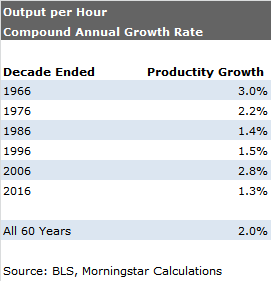
The decadelong data seem more consistent, though these still suffer an endpoint issue. That is, the beginning or ending year, a peak economy year, or in the middle of a recession. Interestingly, the most recent decade isn't too different from the mid-1980s or mid-1990s data. Still, we confess the number isn't great. Productivity growth of 1.5%, if the economy can get back to that, combined with likely population growth of 0.6%, suggests GDP growth of just about 2%.
/cloudfront-us-east-1.images.arcpublishing.com/morningstar/G3DCA6SF2FAR5PKHPEXOIB6CWQ.jpg)
/cloudfront-us-east-1.images.arcpublishing.com/morningstar/VUWQI723Q5E43P5QRTRHGLJ7TI.png)
/cloudfront-us-east-1.images.arcpublishing.com/morningstar/XLSY65MOPVF3FIKU6E2FHF4GXE.png)