
Have Strategic-Beta ETFs Delivered for Investors?
Despite their advantages, on average, these funds haven't been a clear improvement over their cap-weighted counterparts.
/s3.amazonaws.com/arc-authors/morningstar/a90ba90e-1da2-48a4-98bf-a476620dbff0.jpg)
A version of this article appeared in the June 2017 issue of Morningstar ETFInvestor. Download a complimentary copy of ETFInvestor here.
Strategic-beta exchange-traded funds track indexes that make rules-based, active bets in an attempt to deliver better returns, less risk, or some combination of the two as measured against a conventional broadly diversified, market-cap-weighted index.
As of the end of May, there were 637 strategic-beta exchange-traded products that collectively held $619 billion of investors’ assets. Here, we will assess the track records of strategic-beta ETFs across the Morningstar Categories that make up the U.S. equity Morningstar Style Box.
Success Rates The manner we've chosen to measure these funds' success--or lack thereof--mimics the methodology of Morningstar's Active/Passive Barometer (we featured a summary of the findings of our most recent Active/Passive Barometer in the March issue of ETFInvestor). In each of the nine categories included in this analysis, we measure individual strategic-beta ETFs' performance relative to an equal-weighted benchmark of their category peers that track more-traditional market-cap-weighted benchmarks.1
We believe this approach is more pragmatic than sizing these funds up against a single index as it: 1) incorporates the net-of-fees (and other costs) performance of investable alternatives and 2) avoids issues that might arise from cherry-picking a single index as a yardstick (that is to say, results may vary widely depending on the index selected as a basis for comparison). Thus, our approach reflects the real-world performance of funds available to investors and accounts for the diversity of methodologies and resulting performance profiles across seemingly similar indexes.
We compared the performance of each strategic-beta ETF that existed at the beginning of the one-, three-, five-, and 10-year periods ended March 31, 2017, with the equal-weighted performance of their more-vanilla peers. For purposes of calculating success rates, a strategic-beta ETF is considered to have succeeded if it: 1) survived to the end of the period and 2) outperformed the equal-weighted composite of its cap-weighted counterparts. The results of this exercise appear in Exhibit 1.
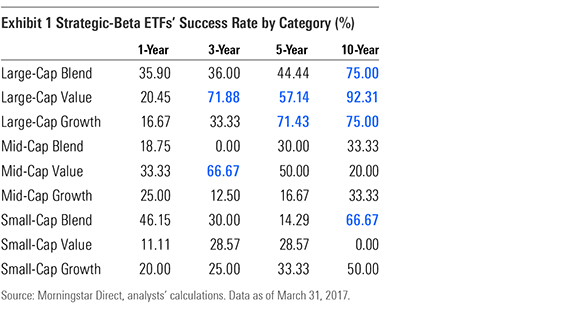
Success rates across the nine categories we examined are mixed. Large-cap strategic-beta ETFs have generally fared better relative to their mid- and small-cap peers. For the 10-year period ended March 31, 2017, 84% of large-cap strategic-beta ETFs outperformed their average cap-weighted passive peer, while just 29% of their mid-cap and 33% of their small-cap counterparts managed the same feat. The most note-worthy results were produced by strategic-beta ETFs in the large-value category, where success rates were greater than 50% during the trailing three-, five-, and 10-year periods.
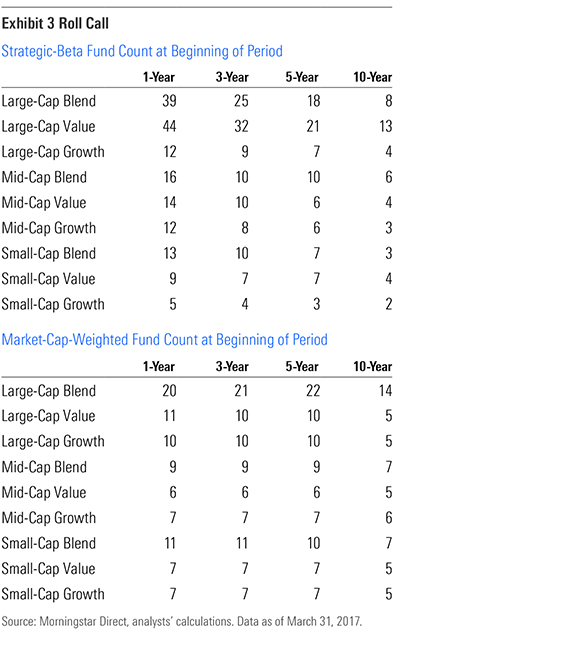
Performance It is important to note that the sample of funds included in this analysis is small (see Exhibit 3), particularly for the trailing five- and 10-year periods and outside of the large-value and large-blend categories. So, to complement the success rate data, we've also included the equal- and asset-weighted performance figures for both cohorts during the 10-year period ended March 31, 2017. Given the small sample sizes, average return data is a more reliable measure of these funds' performance than the success rates, which may be skewed. Average return data is based on a composite of all funds that were available in a given month during the period in question. As such, it includes more funds over longer horizons and thus provides a more meaningful sample.
Exhibit 2 contains equal- and asset-weighted performance data for the 10-year period ended March 31, 2017, for both the strategic-beta and cap-weighted ETFs included in our analysis. Strategic-beta ETFs produced better equal-weighted returns relative to their cap-weighted peers in four of nine categories, including all three large-cap categories. Strategic-beta ETFs’ asset-weighted returns were higher in just two of nine categories. The triumph of the large-cap strategic-beta ETFs as measured by their success rates appears somewhat less glorious when viewing these same funds through the lens of their equal-weighted performance figures. In the case of the large-blend and large-growth categories, these funds’ margin of victory was somewhat narrow. On the other hand, the composite performance of the large-value strategic-beta ETFs trounced that of its cap-weighted cousins.
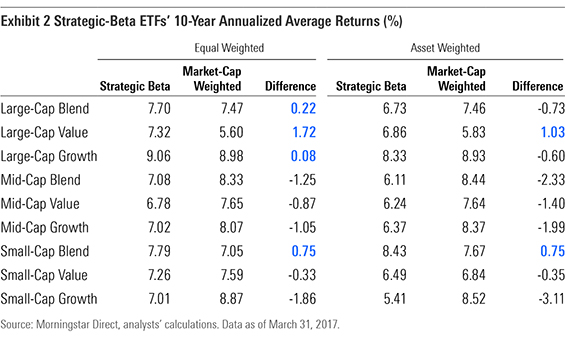
The performance data doesn’t reflect well on investors’ fund-picking skill. In eight of nine categories, strategic-beta ETFs’ asset-weighted returns were less than their equal-weighted returns. This indicates that most of investors’ money has been plowed into funds that produced below-average results relative to the full menu of strategic-beta ETFs. Cap-weighted funds’ asset-weighted returns lagged their equal-weighted returns in five of nine categories. However, in the case of cap-weighted funds, the average difference between their equal- and asset-weighted returns was significantly narrower relative to strategic-beta funds. This speaks to the similarities in index construction among the cap-weighted cohort, which results in a relatively narrow distribution of long-term returns in this group.
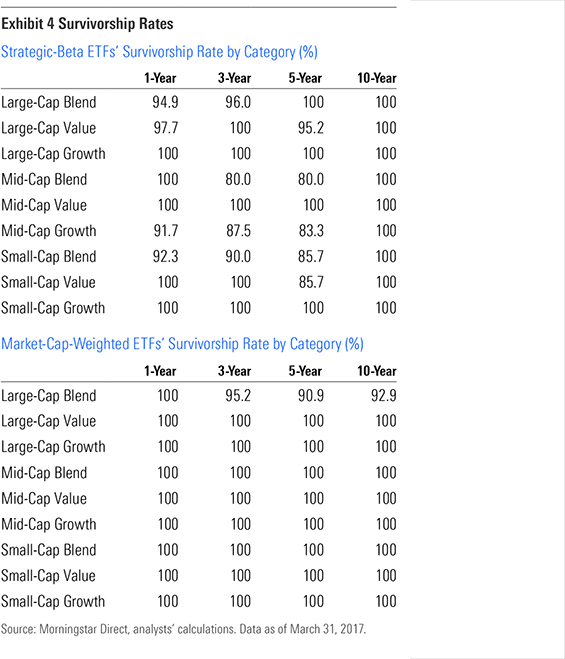
Survivorship The strategic-beta and cap-weighted funds included in this analysis are survivors. In both camps, survivorship rates were 80% or greater across all categories and time periods. The survivorship rates among strategic-beta ETFs are materially higher than those for traditional actively managed funds that we've documented in our Active/Passive Barometer. This difference is likely because this universe is much smaller, less saturated, and less mature than the market for active funds.
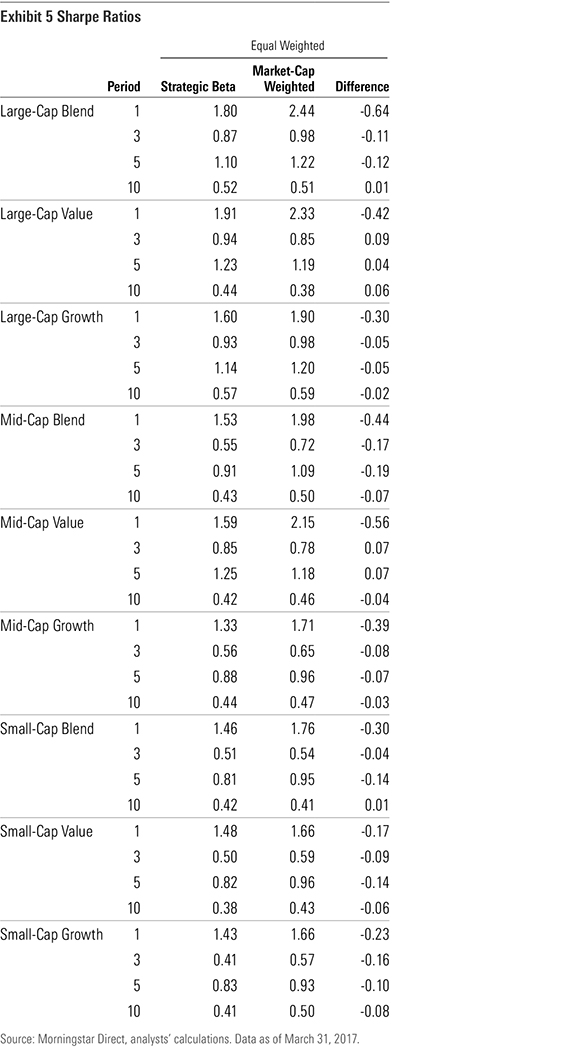
Risk-Adjusted Returns What if strategic-beta ETFs outperform by simply taking on greater risk? To control for the level of risk these funds have assumed, we compared their Sharpe ratios (a measure of risk-adjusted performance) to those of their cap-weighted counterparts. Exhibit 4 shows average Sharpe ratios for each group across the nine categories for the one-, three-, five-, and 10-year periods ended March 31, 2017. By this measure, the gap between the two groups narrows significantly, indicating that the outperformance of strategic-beta ETFs in some categories may be at least partially attributable to the fact that they have, on average, assumed more risk.
- source: Morningstar Analysts
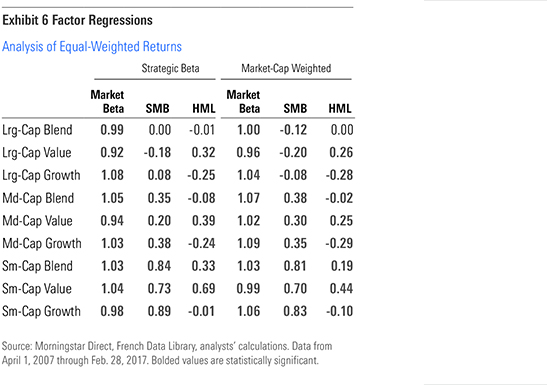
Factor Exposure What about factor exposures? Most of these funds set out to harness well-documented factors like value, but are they doing so efficiently? To get a better understanding, we ran a three-factor regression of the monthly returns of our equal- and asset-weighted composites of strategic-beta ETFs in each of the nine categories to decompose the sources of their return into market beta, size (small minus big), and value (high minus low). We found that strategic-beta ETFs in seven of nine categories had greater exposure to the value factor than their cap-weighted rivals. Also, seven of nine categories had larger loadings on the size factor, indicating a skew toward smaller-cap names. Given that virtually all of these strategic-beta ETFs weight their holdings on the basis of some measure besides market cap, it's no surprise that these funds tend to tilt toward cheaper and smaller stocks.
Key Takeaways 1 | The 10-year success rates for strategic-beta ETFs in the large-cap categories were high but are somewhat skewed, owing to the fact that the sample sizes were small.
2 | Strategic-beta ETFs' results were mixed during the 10-year period ended March 31, 2017. Strategic-beta ETFs generated a higher equal-weighted average return than market-cap-weighted funds in four of the nine categories we analyzed. On an asset-weighted basis, they outperformed in only two categories.
3 | Investors have generally selected below-average performers from the menu of strategic-beta ETFs, as evidenced by the fact that strategic-beta ETFs' asset-weighted performance exceeded their equal-weighted performance in just two of the nine categories we examined for the 10 years ended March 31, 2017.
4 | The survivorship rates were high across the board for both strategic-beta and market-cap-weighted ETFs. To date, strategic-beta ETFs survivorship rates have been much higher relative to actively managed funds.
5 | Lining up strategic-beta ETFs' risk-adjusted returns against those for cap-weighted funds hints that some of these funds' outperformance may be compensation for assuming greater risk.
6 | In every category but large- and mid-blend, strategic-beta ETFs had stronger exposure to the value factor. They also had slightly greater exposure to the small-cap premium (in all but the mid-blend and mid-value-categories).
Conclusion Strategic-beta ETFs attempt to marry the best attributes of active and passive approaches to security selection. Their undeniable advantages over the majority of their actively managed peers include their relatively lower fees, greater tax efficiency, and the absence of idiosyncratic risk--namely key-person risk. Despite their advantages, on average, these funds aren't a clear improvement over their cap-weighted counterparts. All we can say for certain is that they will deliver a risk/return profile that differs from the market. So, like their active peers, they will experience cycles of relative out- and underperformance. Ultimately, whether or not investors reap the benefits of investing in these strategies depends on their ability to stick with them through thick and thin.
Alex Bryan, CFA contributed to this article.
1 We use ETFs that track market-cap-weighted value and growth indexes to form our benchmarks for the corresponding categories. These funds fit Morningstar's definition of strategic-beta but have been carved out for purposes of this analysis.

Disclosure: Morningstar, Inc. licenses indexes to financial institutions as the tracking indexes for investable products, such as exchange-traded funds, sponsored by the financial institution. The license fee for such use is paid by the sponsoring financial institution based mainly on the total assets of the investable product. Please click here for a list of investable products that track or have tracked a Morningstar index. Neither Morningstar, Inc. nor its investment management division markets, sells, or makes any representations regarding the advisability of investing in any investable product that tracks a Morningstar index.
/cloudfront-us-east-1.images.arcpublishing.com/morningstar/T2LGZCEHBZBJJPPKHO7Y4EEKSM.png)
/d10o6nnig0wrdw.cloudfront.net/04-18-2024/t_34ccafe52c7c46979f1073e515ef92d4_name_file_960x540_1600_v4_.jpg)
/d10o6nnig0wrdw.cloudfront.net/04-09-2024/t_e87d9a06e6904d6f97765a0784117913_name_file_960x540_1600_v4_.jpg)
:quality(80)/s3.amazonaws.com/arc-authors/morningstar/a90ba90e-1da2-48a4-98bf-a476620dbff0.jpg)