
Portfolio Duration Doesn't Tell the Whole Story
Investors looking to gauge a fund's interest-rate sensitivity need to look past duration.

The inverse relationship between bond prices and interest rates is a central tenet of bond math. As rates rise, new, higher-coupon bonds become more attractive than previously issued lower-coupon bonds. To entice investors to buy those lower-coupon bonds, prices must fall. Eventually, higher bond yields will be good for investors, but the short-term pain hits investors where it hurts: lower investment returns because of the drop in bond price.
Experienced bond investors may look at a fund's duration (a measure of price sensitivity owing to changes in interest rates) to determine whether a portfolio is "protected" from rising rates. Duration, however, has several shortcomings. It's a good measure of interest-rate risk for noncallable U.S. Treasury bonds, but it becomes less predictive for funds with more credit risk, such as junk bonds, or those with unpredictable cash flows, such as mortgage-backed securities.
In addition, portfolio duration measures assume a parallel shift in the yield curve, or that all rates along the entire yield curve (one month to 30 years) move up or down by the exact same amount. This is almost never the case in the real world.
My colleague, Eric Jacobson, discussed this phenomenon in a previous Fund Spy titled, "What History Tells Us About the Importance of a Fed Rate Hike." Eric looked back at previous rate hike cycles to show that the yield curve acts very differently depending largely on the economic environment, among other factors, during each rate cycle.
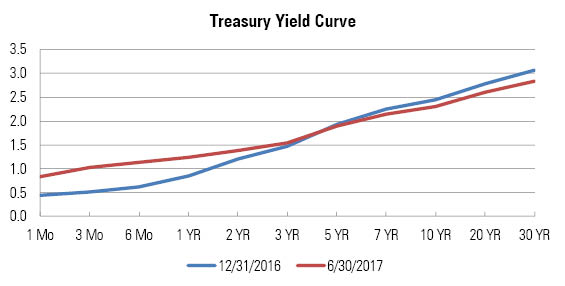
The graph above shows Treasury yield curves as of Dec. 31, 2016, and June 30, 2017. The Fed raised short-term interest rates by 25 basis points in December, then March, and again in June, pushing the short end of the yield curve higher as expected. Market forces, however, play a larger role in longer-term Treasury rates, and the demand for high-quality Treasury bonds remained strong, despite the Fed's rate hikes. Thus, the longer end of the yield curve actually dropped during the first five months of 2017. These kinds of yield-curve shifts can have a meaningful impact on actively managed bond funds, as managers, even those with duration mandates tied to an index, can position their funds at various points along the yield curve to potentially benefit from those movements. This can also mean that two funds with the same headline duration may vary widely in makeup, and their performance during interest-rate shifts may also differ.
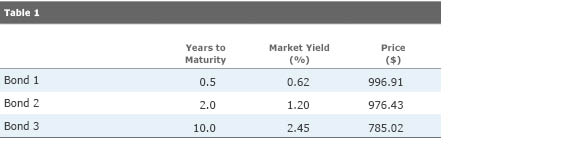
Portfolio duration is a complex topic, but a simple example can illustrate the concept. Assume three zero-coupon Treasury bonds with maturities of six months, two years, and 10 years, held by funds A and B, but in different combinations, each of which will produce an overall average duration of two years. Fund A, for example, allocates 100% of its assets to the two-year bond. By contrast, Fund B owns a mix of six-month and 10-year bonds (roughly 84% and 16%, respectively). Using market rates from Dec. 31, 2016, the tables below show the bonds' prices and implied yields. Because these are zero-coupon bonds, each bond's duration is the same as its maturity.
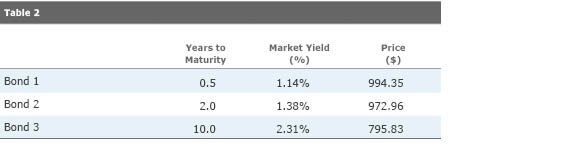
Now, assume an instantaneous shock to the yield curve that causes it to shift to the June 30, 2017 profile. The six-month rate rises to 1.14%, the two-year rate rises to 1.38% and the 10-year drops to 2.31%. Table 2 shows the effect on each bond's price.
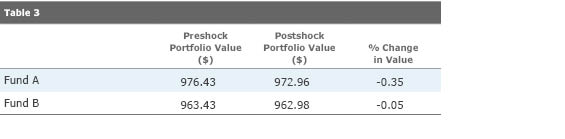
Assuming no changes to the holdings of the funds, Table 3 shows the change in each portfolio's value based on the rate shifts described. Even though both funds started the year with the same portfolio-level average duration (two years), the mix of bonds in each portfolio combined with a nonparallel shift in the yield curve meant that the two funds posted different returns. Fund A lost value, while Fund B posted a positive return. In all, Fund B outperformed Fund A by nearly 30 basis points. Investors expecting the funds to perform similarly would have been quite surprised by the results.
Of course, this example is an extremely basic one. Duration is a complex topic, and gaining insight into the composition of a fund's duration can be challenging even for experienced investors. How the yield curve will continue to shift as the Fed determines the merits of further rate hikes is something of a wild card, especially given the multifaceted macroeconomic environment. What's more, this example assumed portfolios of Treasury bonds. Bonds with additional risk (so-called spread risk) will react very differently to changes in interest rates depending on several factors, including credit quality and investor sentiment.
Nevertheless, it's important to have a handle on what duration can and cannot reveal about a fund's potential behavior. Understanding that the changing shape of the yield curve can affect a fund's value in a meaningful way can allow investors to create more-realistic expectations around returns.
A previous version of this article, by Cara Esser, CFA, was published in February 2016.
/cloudfront-us-east-1.images.arcpublishing.com/morningstar/ZKOY2ZAHLJVJJMCLXHIVFME56M.jpg)
/cloudfront-us-east-1.images.arcpublishing.com/morningstar/IGTBIPRO7NEEVJCDNBPNUYEKEY.png)
/cloudfront-us-east-1.images.arcpublishing.com/morningstar/HDPMMDGUA5CUHI254MRUHYEFWU.png)