
Another Bout of Deflation Ahead?
Transitory special factors have been keeping prices down, but signs suggest some deeper factors at work, too.

We had three important economic reports on Friday: more deflation news, poor retail sales data, and glacially improving industrial production. Markets seemed to take the poor numbers in stride, assuming that a lot of the issues, especially the deflation figures, were transitory. (U.S. Federal Reserve Chair Janet Yellen used that very word.) We agree that lots of funky things are happening with cellphone service pricing and the seasonal nature of healthcare price increases. Still, car prices are falling (both new and used), food prices are down again, and the price almost any physical good is still falling. Even some service categories are showing sustained deflation, including airline tickets. With soft retail sales data this week changing consumer tastes and the Amazon factor, low prices aren’t a total surprise. Pushing prices higher may be harder than the Fed believes. That may be a good thing given last week’s uninspiring wage growth data sets.
After the trifecta of lackluster reports, GDPNow of the Atlanta Fed has cut its estimate of second-quarter GDP down to 2.4% from 2.7%. That compares with the now silly- looking 4.3% estimate it put out on May 1. The new estimate could move lower in the weeks ahead until the first estimates of second-quarter GDP growth are released in early August (along with revisions). Of the major categories, only government has escaped the estimate hatchet, although that isn't saying much as government wasn't expected to contribute anything at the beginning of the quarter and is still expected to contribute nothing. It's eerie that business-fixed investment, net inventories, net exports, and residential investment have seen their individual contributions drop by 0.4% each for a total of 1.6%. Consumer spending fared only modestly better, falling just 0.3% for a grand total of a 1.9% reduction (now 2.4%). The consumer will account for 80% of the growth that GDP now is anticipating in the first quarter. Inventories and business investment account for the rest.
The new 2.4% estimate suddenly doesn’t look so spectacular, especially given the first quarter's subpar 1.2% growth rate. Averaging those two quarters gives us at 1.8%, just about the same level as our full-year estimate, so our readers shouldn't be too shocked. We are slightly worried that necessary adjustments in auto production (due to high inventories) will make growth more challenging than we had hoped. We show a graph at the end of this report that shows auto production substantially outperforming auto sales.
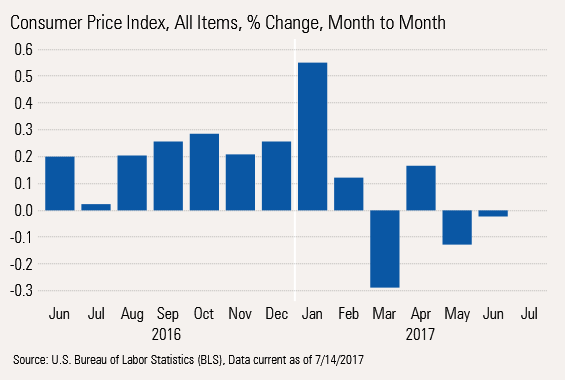
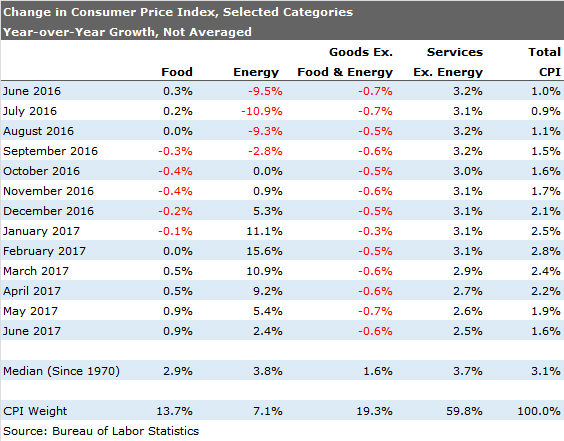
Month-to-Month Data Shows Deflation in Three of Past Five Months The all-item CPI was down fractionally in June compared with May, making for deflationary reports for three of the past five months. And none of these, not one, showed growth an annualized growth rate of greater than 2%. Granted, the large drop in March was indeed due to the oft-cited cellphone service price drop, but those should have worked out of the month-to-month numbers by now (though they will cast a shadow over the year-over-year numbers through at least next February).
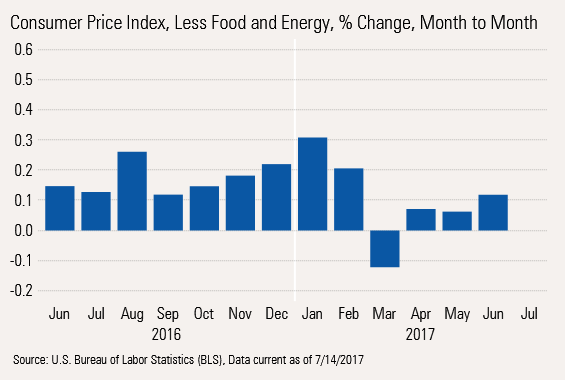
Even Excluding Food and Energy, Inflation Has Clearly Slowed Excluding food and energy, deflation has been avoided except in the cellphone-addled month of March. Still, the more recent bars on the right-hand side of the graph look to be settling in at relatively low levels. Too, the early-in-the-year spikes and the subsequent collapse seem to indicate potential seasonal adjustment issues. I sincerely doubt that I could find a consumer who believed they were socked by sky-high inflation only to be faced with lower prices just months later.
Year-Over-Year Data Also Shows Moderating Inflation The core inflation rate hasn't moved a lot on a year-over-year basis. The current averaged year-over-year rate of 1.9% is nevertheless at the bottom of its 1.9%-2.3% channel. Given that the single-month year-over-year data has dropped to 1.6%, I would suspect that the channel will continue to move lower.
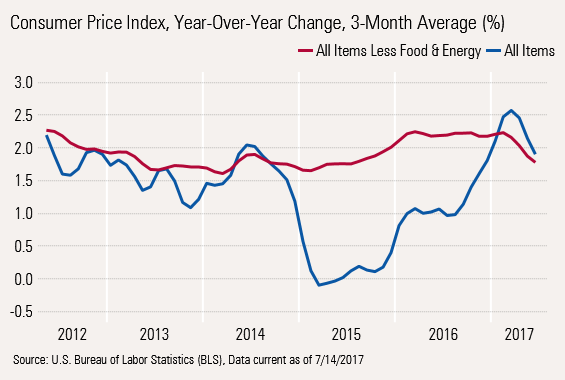
As we suspected, core and all inflation rates are getting very close to each other. Depending on the impact of recent stormy weather in the Midwest, we're expecting neither a surge in food prices nor further big decreases as the big grain price decline of several years ago has now worked its way through the last elements of the food chain, namely beef. Energy prices seem to be kind of stuck in neutral too, with low prices causing production to be shut in, stabilizing prices. With a plethora of wells that have been drilled in the U.S. but not completed, any increase in price will be quickly matched by increased supply.
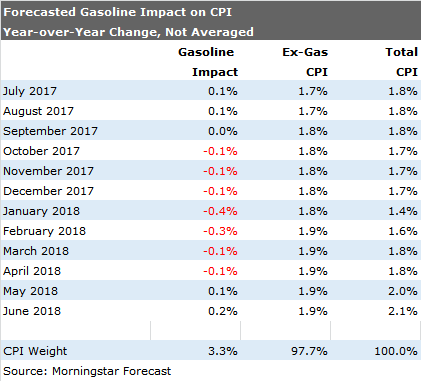
Gasoline Will Continue to Have a Meaningful Impact on Total Inflation Even we are shocked at how stable prices have been without just one component: gasoline. Even though gasoline makes up only about 3% or so of CPI, double-digit price moves can have a huge impact, as shown below.
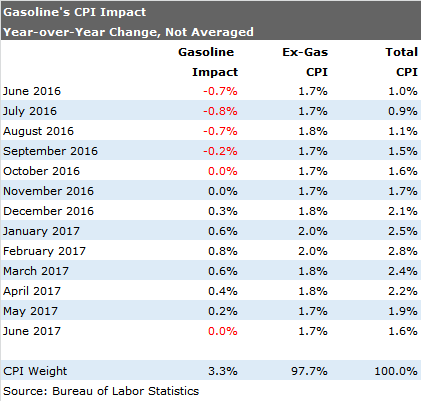
Going Forward, Inflation Could Drop as Low as 1.4% Before Moving to 2.0% Next Spring Assuming that ex-gasoline prices maintain their current inflation rate, gasoline prices remain stuck at currently seasonally adjusted prices, and the 0.2%-0.3% negative contribution from cellphone service continues until February (the new allegedly cheaper plans began in February of this year), a forecast is relatively easy to construct. Surprisingly, with these modest assumptions, inflation could fall as low as 1.4% next January. The number could back up to closer to 2% if gasoline prices stabilize and cellphone service plan prices don't move into some type of free-fall. Again, all bets are off if there is a geopolitical event that sends oil soaring, or if there's some type of government action that sharply increases the price of imported goods.
Inflation Downshift Transitory, or the Start of Something Worse? We were relatively surprised earlier this year when inflation peaked a few months earlier than we expected. Since then we have reduced our inflation estimates twice. Each time we thought we were being aggressive with our cuts, but every time new circumstances arose that forced us back to the chalkboard for a new analysis. It has been gasoline prices, then food prices, then used car prices that forced down new car prices, and then there was the whole cellphone debacle. We have dutifully explained each of these away as something short-lived, likely to quickly disappear. However, why do these special factors keep showing up? We posit that demographics are putting a bigger lid on prices than we would have expected. Note the only two significant categories showing year-over-year inflation are healthcare and housing. Everything else is seeing price increases of 1% or less. This seems to indicate something deeper than special factors at work.
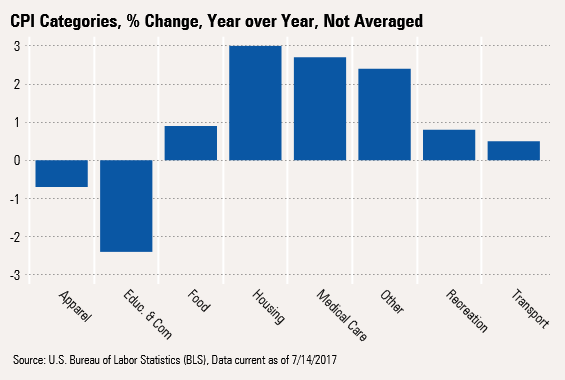
Our Broad Category Analysis Shows Limited Potential for Sharply Higher Prices Of the major categories, only food is showing any signs at all of moving higher, and even that showed a single month of decline in grocery store prices in June, potentially killing any upward momentum. Likewise, recent work we have done on noncompleted oil and gas wells suggests that prices won't be moving dramatically higher anytime soon. Services prices will likely move higher again, but only after we lap the big cellphone service price decreases. If rents and owner-equivalent rents ever stop going up at a close-to 4% rate, even the service category could drift meaningfully lower. Housing composes almost two thirds of the services category. (Rent, or implicit rents for a homeowner, are considered a service, oddly.)
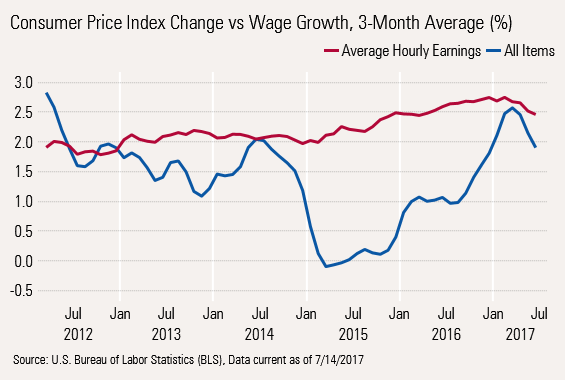
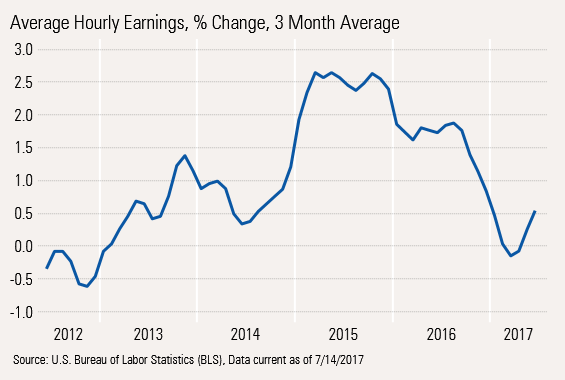
Our Major Concern for 2017 Was Inflation Accelerating Faster Than Wages Our big worry for 2017 was that the closing gap between hourly wage growth and inflation would hurt consumers much more than most economists were anticipating. While there was a lot of happy talk about government stimulus and tax cuts, we could clearly see the positive spread between hourly wages and inflation was closing quickly. Indeed, that gap all but disappeared this spring, and we can see the dramatic negative effect in the retail sales numbers that we show later in this report. While hourly wage growth has been slumping for a variety of reasons that we noted in this week's video, inflation rates have fallen a bit faster, potentially providing a little more gas for consumers in the months ahead. Some, not a lot.
Inflation-Adjusted Wage Growth May Have Bottomed
The graph below merely subtracts inflation from wage growth shown above to show a net number to workers. 2015 was a great year for workers and a great year for retail sales. It wasn't soaring wages--it was low inflation that drove the real wage higher (though higher wages helped, too).
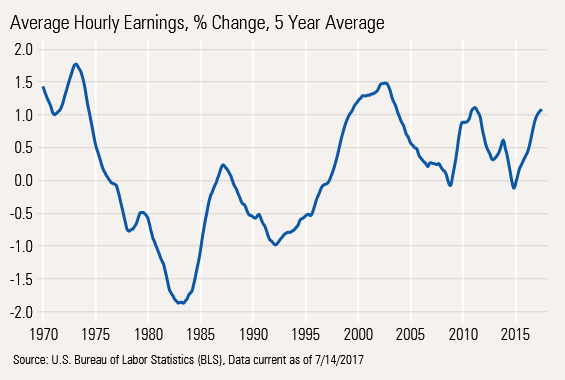
The Golden Age May Be Over, but at 1%, Real Hourly Wage Growth Should Be Quite Acceptable Real wage growth has never really amounted to much. Going back over 50 years, real hourly wage growth has never been very high. Averaging over five years--to blunt some of the impact of recessions--wage growth has been above 1.5% annually twice in over 50 years and two more times has it been much more than 1%, including the current bout. Workers have been on the wrong end of the stick for some time, especially during the '70s and '80s.
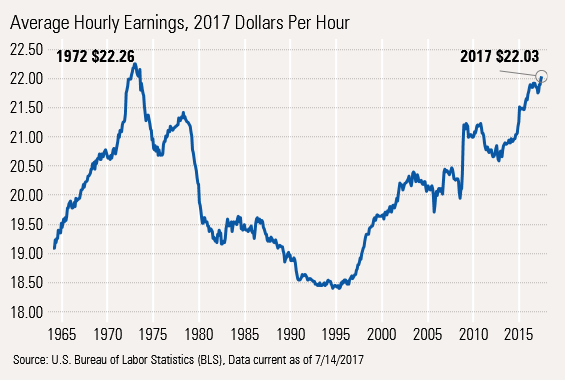
The Occasional Large Decline, Followed by Bounces, Disguises That Real Wages Have Gone Nowhere in 45 Years
I work with a lot of wage data all the time, often using a lot of year-over-year growth rates, usually excluding recessionary periods. I knew workers hadn't been doing particularly well (baby boomers flooding the labor force, then women, and finally immigrants and overseas outsourcing). Still, even I was a bit surprised to see that the hourly wage has barely budged.
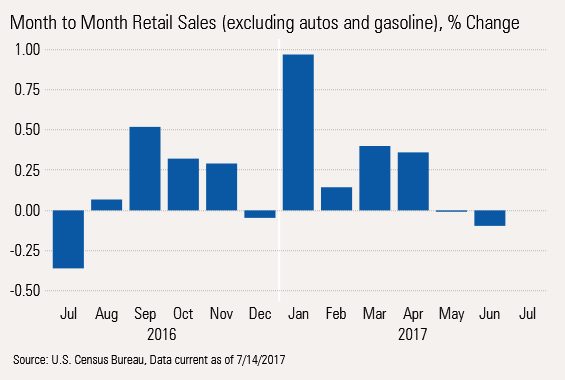
Retail Sales Continue to Slump, at Least Partially Because of the Real Wage Issue
Retail sales excluding autos (which aren’t doing so well, either) and gasoline (which isn't seeing a lot of growth outside of price) continue to be in a funk. Inflation-adjusted sales have been down sequentially for two months in a row despite mediocre growth in the prior two months.
Even the Year-Over-Year Numbers Are Beginning to Slip
I was a bit hesitant to include the graph below that shows a relatively dramatic increase in June, even on an averaged basis. June last year was unusually strong, making the comparison nearly impossible. The graph above shows that some of that gain quickly reversed itself, which means there is a real possibility that the graph below for the year-over-year data won't look quite so Draconian next month.
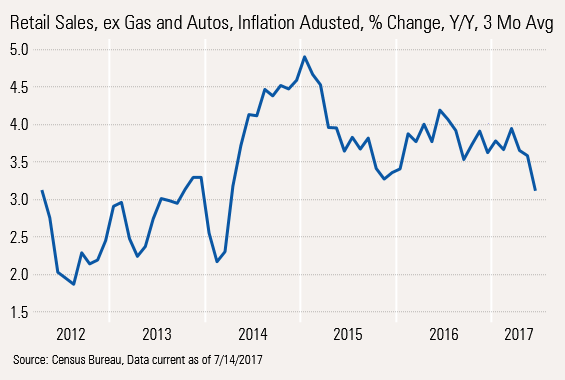
Unfortunately, the best case seems to be that retail sales growth continues to shrivel, though perhaps not quite as dramatically as the dip from 5.0% in 2015 to 3.2% now would suggest. We are particularly worried about what this might mean to retail employment, which still doesn't seem to have suffered the full impact of slowing sales.
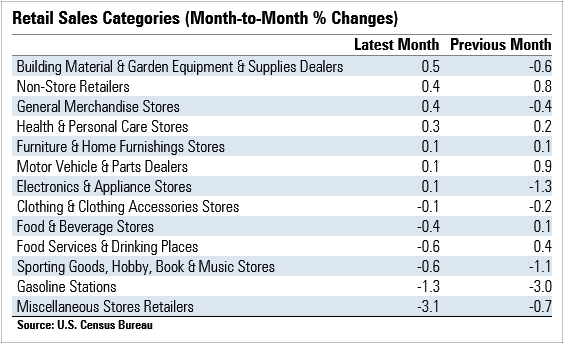
Retail Softness Looks Relatively Broad-Based
To look at month-to-month numbers, especially when not inflation-adjusted, is always a bit risky, but they are still worth a look. To add a bit of perspective, if one considers 3.6% or so the norm for annual retail sales growth, monthly growth should be about 0.3% as a starting point (3.6/12). Only building materials stores (favorable weather?), nonstore retailers (Amazon), and the general merchandise category beat that bogy. This long list of performers, including the food-service industry, is daunting to us--indicative either of some real problems or some type of statistical boo-boo.
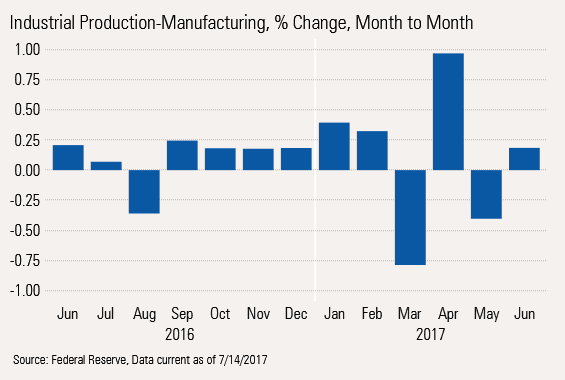
Industrial Production Somewhat Better, but We Are a Little Worried
Monthly industrial production has been volatile and trendless lately, as shown below. At least the latest month is up.
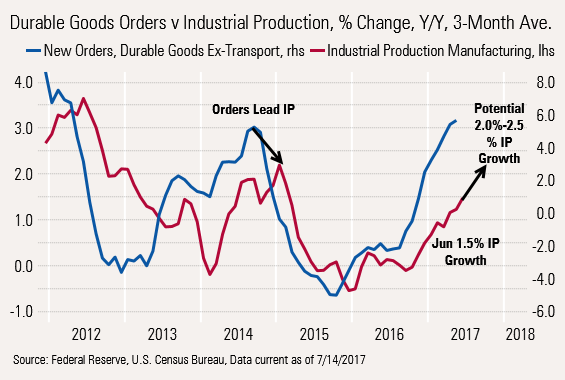
Year-Over-Year Data Industrial Production Continues to Improve; Based Solely on Order Data, Industrial Production Could Improve Some More
We Are Worried About Slumping Auto Sales and Increased Auto Production
The widening gap between production and sales growth is not great news for second-half growth of industrial production.
/cloudfront-us-east-1.images.arcpublishing.com/morningstar/F2S5UYTO5JG4FOO3S7LPAAIGO4.jpg)
/cloudfront-us-east-1.images.arcpublishing.com/morningstar/7TFN7NDQ5ZHI3PCISRCSC75K5U.png)
/cloudfront-us-east-1.images.arcpublishing.com/morningstar/QFQHXAHS7NCLFPIIBXZZZWXMXA.jpg)