
Income Growth Could Pressure Consumption Growth
The gap between wage/income growth and consumption has grown uncomfortably wide, perhaps signaling weaker consumption growth ahead.

As we discussed in this week's video, a lot of the midweek economic data was less than inspiring, with slowing durable goods orders, a depressing June (and full-year reductions, too) motor vehicle sales forecasts, and another monthly decline in pending home sales.
Some analysts cheered the upwardly revised first-quarter GDP growth estimate. From the first guess to this third revision, the estimate has moved from 0.7% to 1.4% (and there will be the annual, comprehensive revision and re-benchmarking next month, so this isn't final yet). We view the better GDP data as too backward-looking to be much help.
Looking ahead, based on data so far, the Atlanta Fed's GDPNow forecast for the second quarter has slipped yet again from 2.9% to 2.7% after starting the quarter with a forecast of over 4%. Data out of Europe continued to be better than expected even as things here in the U.S. look at least a little worse.
Since our midweek video, consumption data for May looked soft, as expected, with some help from weather and the utility sector. Income data looked better on a month-to-month basis, but that was inflated by an unusually large jump in dividend income that accounted for almost two thirds of the unusually large monthly income gain in May. Year-over-year averaged wage and income data looked terrible, showing just 2% growth compared with consumption growth of about 3%. Today we will take a deeper dive into the consumption data, since our weekly video hits the highlights of the other data points released this week.
Before we launch into analyzing the BEA's report on personal income and consumption, it is crucial to understand how important consumption is in determining the health of the U.S. economy, and the flaws and weaknesses of this report. First, by its sheer size, consumption is the largest part of GDP at 69.4%, dwarfing both business investment and government, which comprise around 17% of GDP. Net exports (exports minus imports) are generally a small subtraction from GDP. And to a degree, consumption/income drives business investment spending and residential investment. Through taxation of income and spending, even government spending had some relation to how the consumer is doing. Only exports aren't influenced to some degree by the U.S. consumer (obviously, imports are).
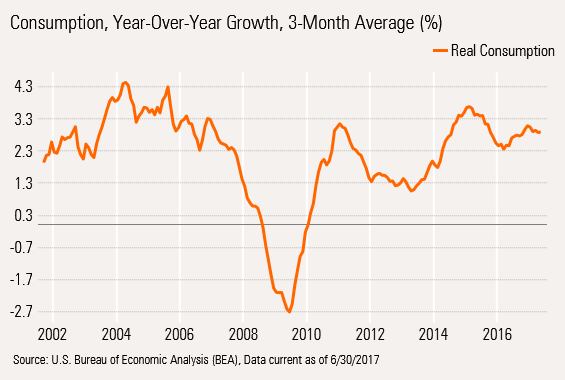
However, consumption tends to move in relatively narrow bands. Since the turn of the century, year-over-year consumption growth has been in a very narrow range of negative 2.7% to 4.3%, even including the Great Recession. The compound growth of consumption over the same 15-year period is about 2.2%. Without the unusual nasty recession consumption, it probably averages in the 2.5%-3% range. The May report issued this week showed consumption growth of 2.9% on a three-month averaged, year-over-year basis.
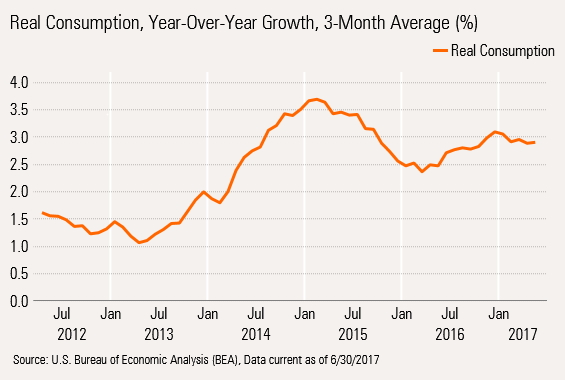
We have blown up the most recent five years of data to show the ups and downs in consumption as well as some stabilization, albeit below the peak level of 3.7% growth that came in early 2015, which was inflated by unusually favorable weather compared with 2014's polar vortex-dominated statistics. If you visually bump up the early 2014 growth rates and push down the 2015, consumption growth looks quite stable at just under 3% or so.
The other components of GDP, while much smaller, are more volatile and can still have a huge impact on GDP, especially at the beginning of a recovery when businesses are rebuilt and government spending is generally stronger (intentional stimulus, built-in stabilizers, and government inertia). Meanwhile, hiring and wage growth is generally slower at the beginning of a recovery as memories of a painful recession weigh on hiring decisions.
Below, we show the four large sectors and their relative contribution to GDP growth. Simplistically, these represent growth rates times the weighting in the GDP calculation.
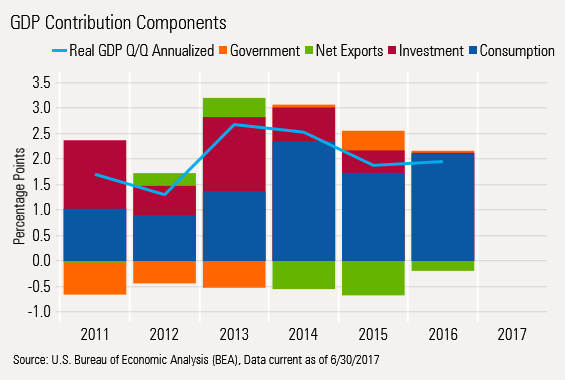
By 2016, the economy had become a one-trick pony dominated by the consumer, with essentially no help from the other three major sectors. That is why it is so important to figure out what the consumer is doing.
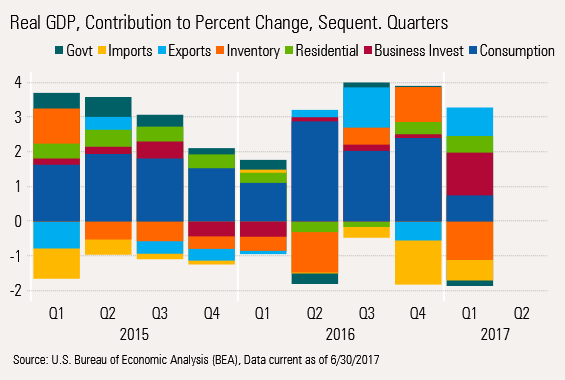
In the first quarter, on a sequential basis, the consumer didn't perform so well and took overall GDP growth with it. The wide swath of blue grew smaller in the first quarter, and GDP fell to just 1.4%. As a point of warning, the graph shows sequential data, which is how the media generally looks at the data.
So hopefully, we have made the case as to why it is so important to understand consumption.
Consumption Data Is Both Comprehensive and Inflation-Adjusted, but It Has Its Flaws As much as we love consumption data, it does have its shortcomings. First, the data is a little stale by the time it is released. It is one of the last pieces of monthly data we receive. Auto sales and retail sales are released substantially earlier in the month than the consumption report. In fact, auto sales for June will be released next week, and weekly retail sales for Fourth of July week will be available on July 11. Yet, the consumption report just released Friday is for May.
And because retail sales often are revised sharply in subsequent reports, consumption also gets some large revisions. In addition, healthcare spending is pretty much a trend line number with some sampled data until many months after the initial report is filed. And a combination of complex seasonal adjustments and weather factors can turn month-to-month data into indecipherable mush.
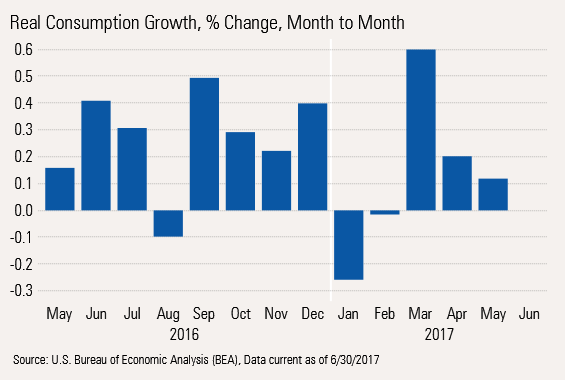
That monthly volatility is quite visible in the above month-to-month bar graph above. Utility usage can wreak havoc on the data, too. Taking utility numbers out of the equation provides a steadier picture. Unfortunately, it still shows that consumption growth continues to slow on a month-to-month basis. The current data shows almost no consumption growth in May, excluding utilities.
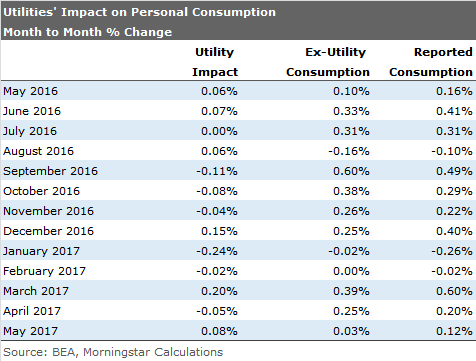
The impact is much less in the year-over-year, averaged data, with a utility contribution of about 0.1% to the year-over-year, averaged consumption rate of 2.9%.
Looking ahead, we suspect month-to-month consumption, excluding any utility effect, will be modest, perhaps 0.2%-0.3% (which annualizes to roughly 2.4%-3.6%). That range represents recent trends. Brick-and-mortar retail should act a little better in June as the weather warmed and weekly surveys showed some nice improvement at month-end. Healthcare growth, which has been performing below trend recently, is also due for a bounce. Still, the motor vehicle market continues to look terrible and will act as an anchor on growth much above trend line rates.
Consumption growth for the full second quarter should be close to 3%, a nice improvement from the weather-addled 1.1% registered in the first quarter. Unfortunately, because June was relatively strong last year, the year-over-year averaged growth rate (basically second-quarter year-over-year data) could drop to 2.6%-2.7% from 2.9% unless the utility sector kicks in a little help--or the early read on June auto sales is wrong.
Wage and Income Growth Could Weigh Further on Consumption Growth Through a combination of higher inflation and slower employment growth, wage and disposable income data, adjusted for inflation, looks considerably less robust than the consumption data, at least in recent months.
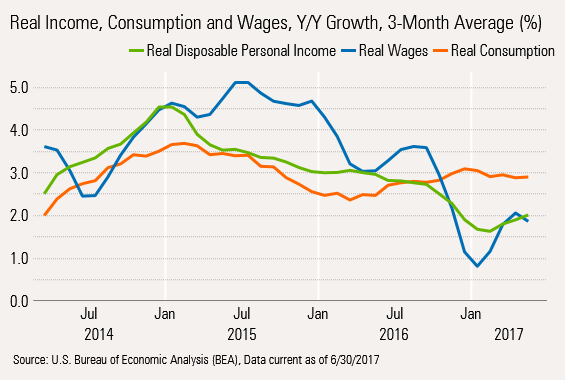
As we have beaten to death, consumption has been running at 2.9% or so for most of 2017. Wages (about two thirds of all income) and the real inflation-adjusted personal disposable income number are lumbering along at a slower 1.9% and 2.0% rate. In the short run, either wages or consumption can run at slightly different paces, though over the long term the fit is very tight.
We came through a period in 2015 when wages ran well ahead of both income and consumption. In 2016 wages, income and consumption all moved quite closely together. Now in 2017, the gap between wage and income growth and consumption has grown uncomfortably wide, perhaps signaling weaker consumption growth ahead. That is, unless consumers spend more of their salaries or take out more loans to buy things. Aging baby boomer dynamics (retirees tend to consume less, and near-retirees are often bigger savers) argue against counting on loans or savings to bail out slower total wage growth.
Consumption growth that looks more like the 2% or so total wage growth rate we are seeing instead would be a decent shock, considering consumption has been running closer to 3%. Wage growth will continue to be a real tug-of-war between a dramatic slowing in the native-born working-age population and higher wages that result from labor shortages. We are hoping the dynamics play out for wage growth that eventually rebounds to 2.5%-3.0% from today's meager 2.0% level.
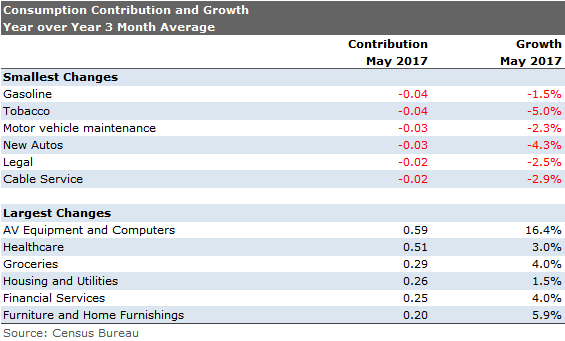
The Outsize Impact From Computers and TVs Is Truly Worrisome We provide both the contribution to consumption growth and the absolute level of growth provided by sector, noting both the largest and smallest contributors, on a year-over-year, averaged basis. We were chagrined that the largest contribution was AV equipment (televisions, Blu-Ray players, stereos) and personal computers, which are largely imported goods. Meanwhile, autos, a largely domestic product, is now registering declines.
/cloudfront-us-east-1.images.arcpublishing.com/morningstar/T5MECJUE65CADONYJ7GARN2A3E.jpeg)
/cloudfront-us-east-1.images.arcpublishing.com/morningstar/VUWQI723Q5E43P5QRTRHGLJ7TI.png)
/d10o6nnig0wrdw.cloudfront.net/04-22-2024/t_ffc6e675543a4913a5312be02f5c571a_name_file_960x540_1600_v4_.jpg)