
Top 10 Holdings of Our Ultimate Stock-Pickers' Index
While Healthcare names continue to present opportunities, our lists revealed names from other sectors that may be compelling.

Every fund investor would like to see the manager of the actively managed funds that they own beat the market every year, but they've been left wanting for well over a decade.
The lack of consistent outperformance on the part of large-cap active managers (the main contributors to the Ultimate Stock-Pickers concept) has been well documented by the S&P Indices Versus Active Funds (SPIVA) U.S. Scorecard. For the five-year period ended in December 2016, the index group noted that 88.3% of active large-cap fund managers had on average underperformed the S&P 500 TR Index. The results have been similar across all investing styles. A paltry 8.5% of large-cap value managers have outperformed their index, versus 12.1% of large-cap core managers and 15.2% of large-cap growth managers outperforming their respective benchmarks.
Unsurprisingly, the gap in year-over-year performance between the S&P 500 TR Index and large-cap active equity managers persisted on the heels of the post-election rally, as market expectations broadly lifted all stocks, seemingly regardless of valuation. At the end of 2016, large-cap active equity managers trailed the benchmark index by 221 basis points, slightly narrowing the 326-basis point gap during the first half of the year in year-over-year performance, however.
For year-to-date performance as of the end of May, Morningstar’s own all large-cap (9.2%), large-cap core (7.8%), large-cap growth (14.1%), and large-cap value (4.0%) categories have posted returns that reveal value appears relatively out of favor compared with growth, suggesting that out of all investment styles, value-oriented managers have continued to face headwinds against the S&P 500 TR Index (8.7%) during the early part of the year.
The fund managers represented in our Ultimate Stock-Pickers concept have had their own issues with relative long-term performance, with their 1-, 3-, and 5-year performance levels being the biggest detractors. While we had 12 of our 22 top fund managers beating the S&P 500 on a 10-year basis at the end of last week, just three and seven managers, respectively, were beating the benchmark on a 3- and 5-year basis. There is some room for encouragement, though, as eight of our fund managers were beating the S&P 500 on a year-to-date basis at the end of last week, with nine of those same managers beating it over the prior year, which should positively impact performance as we move forward.
As a reminder, the Ultimate Stock-Pickers concept was devised as a stock-picking screen, not as a guide for finding fund managers to add to an investment portfolio. Our primary goal has been to identify a sufficiently broad collection of stock-pickers who have shown an ability to beat the markets over multiple periods (with an emphasis on longer-term periods). We then cross-reference these top managers’ top holdings, purchases, and sales against the recommendations of our own stock analysts on a regular basis, allowing us to uncover securities that investors might want to investigate further. There will always be limitations to our process, as we focus only on managers that our fund analysts cover, and on companies that our stock analysts cover, which serves to reduce the universe of potential ideas that we can ultimately address in any given period. This is also the main reason why we focus so much attention on large-cap fund managers, as they tend to be covered more broadly on the fund side of our operations and their stock holdings overlap more heavily with our active stock coverage universe.
That said, by limiting themselves to the largest and most widely followed companies in the investment world, our top managers may miss out on some smaller ideas that have the potential to generate greater levels of outperformance in the long run. The rally in the markets since the U.S. elections has left the markets trading slightly above our own analysts’ fair value estimates, with our Market Fair Value ratio at 103% at the end of last week.
Taking a look at the Cyclically Adjusted Price/earnings (CAPE) Ratio, which divides the current market price by the average of 10 years of earnings (adjusted for inflation), the ratio currently stands at around 30.0. This is compared with a historical mean of 16.8 and median of 16.1, with Shiller relying on market data from both estimated (1881-1956) and actual (1957 onward) earnings reports from companies represented in the S&P 500 Index. Historical values have ranged from a low of 4.78 before the bull market run of the 1920s and 44.2 at the end of the dot-com bubble in late 1999. The CAPE Ratio is generally used to assess potential future returns from equities over longer time frames, with higher-than-average CAPE values implying lower-than-average long-term annual returns going forward, which is what we’re gleaning from the current ratio. While not intended to be an indicator of impending market crashes, it has provided warnings signs for investors in the past.
Morningstar Ultimate Stock-Pickers TR Index Performance Relative to the S&P 500 TR Index (as of 5/31/17)
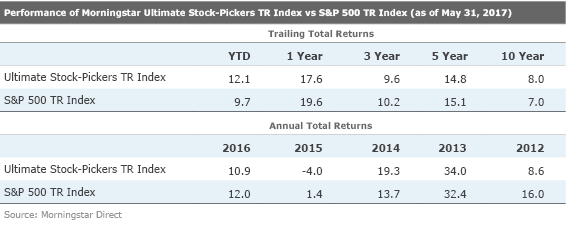
Aside from tracking the holdings, purchases, and sales as well as the ongoing investment performance of our Ultimate Stock-Pickers, we also follow the makeup and results of the Morningstar Ultimate Stock-Pickers TR Index. For those who may not recall, the Ultimate Stock-Pickers index was set up to track the highest conviction holdings of 26 different managers, a list that includes our 22 top fund managers as well as the investment managers of four insurance companies—
The index itself is composed of three sub-portfolios—each one containing 20 securities—that are reconstituted quarterly on a staggered schedule. As such, one third of the index is reset every month, with the 20 securities with the highest conviction scores making up each sub-portfolio when they are reconstituted. This means that the overall index can hold anywhere between 20 and 60 stocks at any given time (because some stocks may remain as the highest conviction score holders in any given period, meaning there can be overlaps in the holdings, reducing the total number of different stocks held). In reality, the index is usually composed of 35 to 45 securities, holding 42 stocks in all at the end of May. These stocks should represent some of the best investment opportunities that have been identified by our Ultimate Stock-Pickers in any given period. It can also have more concentrated positions than one might find in a typical mutual fund, with the top 10 (25) holdings in the index accounting for 47.8% (85.7%) of the total invested portfolio at the end of last month. The size and concentration of the portfolio does change, though, as this is an actively managed index that tries to tap into the movements and conviction levels of our top managers over time.
Top 10 Stock Holdings of the Morningstar Ultimate Stock-Pickers TR Index (as of 5/31/17)
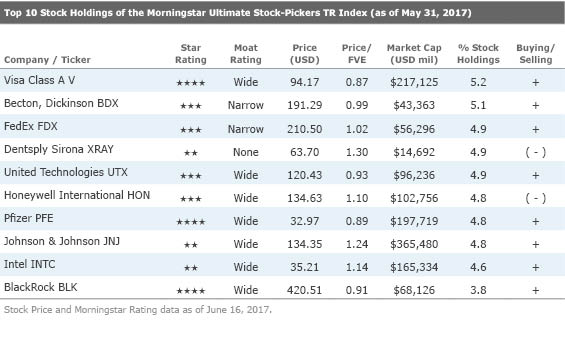
Looking at the top 10 stock holdings of the Morningstar Ultimate Stock-Pickers index at the end of May, there are currently only a couple of names trading at over a 10% discount to our analysts’ fair value estimates. This contrasts with our last publication, where several names offered a more compelling margin of safety at discounts to fair value estimates of over 20%. Wide-moat rated
Sinegal also believes that Visa is winning the war for electronic payments and dominates the global market. He likens the company to a toll booth on global spending. According to the Nilson Report, Visa accounts for about half of all credit card transactions and an even higher percentage of debit card transactions. Visa has had a competitive advantage in coordinating the interaction of banks, consumers, and merchants for decades. For a payment method to be useful, it must usually be accepted by numerous merchants. Conversely, merchants have little incentive to accept a payment method used by just a handful of consumers. The company’s effective network consists of 16,800 financial institutions, 44 million merchants, and billions of cards issued to customers around the world. Sinegal believes that this has created formidable barriers to entry.
Further, Visa and its partners have spent billions of dollars over decades to create their brand. Customers know that Visa-branded cards are likely to be accepted worldwide and that their financial information is fairly secure. Whereas many potential competitors have close connections to consumers, the global financial institutions that rely on Visa are far harder to penetrate, in Sinegal’s view. As proof, Sinegal adds that tech giants like
Wide-moat rated
Pfizer has also benefited recently from launching several potential blockbusters in cancer, heart disease, and immunology. The company’s leading salesforce is another advantage, in Conover’s view. Pfizer’s commitment to post-approval studies provides its sales people with an arsenal of data for their marketing campaigns. Conover also believes that the company’s salesforce is uniquely positioned around the globe to benefit from the increasing wealth of emerging market nations, including the economies of Brazil, Russia, India, and China (BRIC). Lastly, Conover believes that acquisitions like the firm’s purchase of Wyeth help insulate the firm from any one particular patent loss, and that the firm can withstand the increasing competition posed by generics. He adds that over the long term, he believes Pfizer’s more diversified lineup of drugs should reduce earnings volatility in the future.
Top 10 Contributors to the Performance of the Ultimate Stock-Pickers Index (6/1/16-5/31/17)
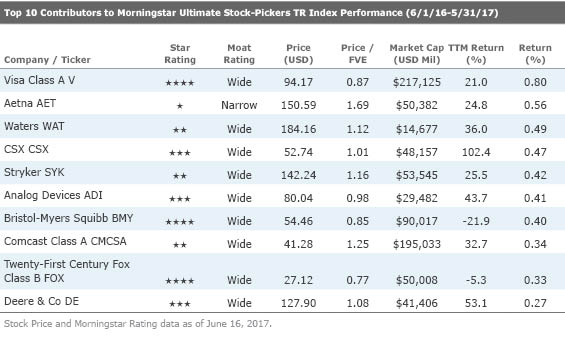
Looking at the year-over-year performance of the Morningstar Ultimate Stock-Pickers index from June 1, 2016, to May 31, 2017, the top 10 contributors included Consumer Cyclical and wide-moat rated name
Twenty-First Century Fox Class B shares currently trade at a 23% discount to our analyst’s fair value estimate, while Class A shares trade at a 22% discount to fair value. In a recent note, Morningstar analyst Neil Macker believes that the stock offers an attractive entry point for investors. Fox posted a slightly worse-than-expected fiscal third quarter, with revenue and EBITDA margins both slightly below his expectations for the firm. The film studio’s results have continued to disappoint investors, and the cable segment continues to suffer from demonetization in India. While Macker acknowledges that the quarter was disappointing, he is encouraged by the continued strength of the domestic cable business, which posted affiliate fee growth of 8%.
Macker believes that Fox enjoys strong competitive advantages based on the its worldwide cable networks, along with its film and television studios. He thinks that Fox is well situated to capitalize on increasing content value as the average household spends over five-and-a-half hours a day watching TV, according to Nielsen. Macker adds that the filmed entertainment segment generates a number of hit television programs and movies annually. In his view, the firm owns both robust film franchises and a strong television production studio. The firm's studios currently produce 70% of the prime-time slate on the Fox channel, as well as the majority of the original programming on its cable channels. Additionally, Fox also produces other critically acclaimed programming content for other networks, including Modern Family on ABC and Homeland on Showtime. Macker believes that the quality of its studio's content, along with the firm's willingness to place its shows on the right outlets, enables Fox to both attract and retain content creators.
Further, Macker points out that consumers still consume news and sports programming in real time, not time-shifted on a DVR. This is a trend that advertisers value. Macker highlights that Fox News remains the market leader in news and that its recent growth has turned it into one of the top 10 overall most-watched cable channels. Macker expects Fox to leverage this position into earning higher affiliate fees as distributors cannot afford to blackout popular channels. As for other content, Macker points out that the Fox broadcast network provides the company with an important platform for showcasing content as broadcasters are the only outlet to reach nearly all 116 million householders in the United States. Fox owns one of four major U.S. national broadcast networks and affiliated TV stations in 18 markets. This includes nine of the top 10 markets. Notably, the network holds the rights for the National Football League, college football, Major League Baseball, and other sports. Macker believes that the combination of original programming and exclusive sports rights should allow the network to sharply increase its revenue. While market penetration for Fox in international pay-television remains below the level in the U.S., Macker believes that it will continue to expand over the near future, catalyzing both ad and affiliate fee growth.
Wide-moat rated Bristol-Myers Squibb Company is the other name of interest to us on our list of top contributors. The firm currently trades at a 15% discount to our analyst’s fair value estimate. Morningstar Healthcare director and analyst Damien Conover also covers the name. While Conover recently lowered his fair value estimate, he still views Bristol-Myers Squibb as one of the best investment opportunities in immuno-oncology. Conover believes that recent data continues to support his 2021 $28 billion sales estimate for the overall immuno-oncology industry, above the $22 billion consensus estimate. In particular, Conover thinks that Bristol’s cancer drug Opdivo holds the potential to revolutionize cancer treatment. He thinks that Opdivo should develop into a multi-billion-dollar opportunity based on solid efficacy, combination potential with other drugs, and strong pricing power. The firm's first-mover advantage in the space should also translate into leadership in market share, and its more focused operations and increasing cash account also make the company an attractive acquisition target for a larger pharmaceutical firm.
Conover further adds that Bristol-Myers Squibb’s partnerships and acquisitions have built a strong portfolio of patent-protected drugs. He thinks this should provide the firm ample time to bring forward the next generation of new drugs. By selling off business lines unrelated to its core pharmaceutical strategy, Conover thinks the company has streamlined its focus to primarily specialty pharmaceuticals. In addition, Conover points out that some of Bristol’s currently marketed drugs are biologics, which have a higher cost of development and marketing for competitors than other small molecules. These factors as well as an entrenched salesforce and economies of scale, reinforces Conover’s belief that Bristol benefits from a wide moat.
Top 10 Detractors From the Performance of the Ultimate Stock-Pickers Index (6/1/16-5/31/17)
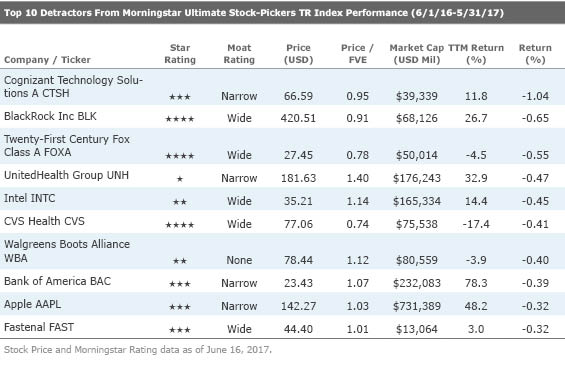
As for the largest detractors, wide-moat rated
Lekraj’s valuation for the firm anticipates solid profit expansion over his explicit forecast. He bases this assumption on his view that the firm should be able to process a greater mix of specialty pharmaceutical claims. Lekraj’s model also accounts for competition from nonexclusive generic drugs and regulatory headwinds. Despite both consumer discretionary spending and supplier consolidation risks, Lekraj expects highly positive returns on invested capital over the long term, spurred by synergetic capital efficiencies and increased pharmaceutical purchasing volume. With a competitive advantage that has produced outstanding returns on invested capital and increasing integration with institution providers, Lekraj believes that CVS has a solid platform for continued success.
If you're interested in receiving email alerts about upcoming articles from The Ultimate Stock-Pickers Team, please sign up here.
:quality(80)/cloudfront-us-east-1.images.arcpublishing.com/morningstar/RFJBWBYYTARXBNOTU6VL4VSE4Q.png)
:quality(80)/cloudfront-us-east-1.images.arcpublishing.com/morningstar/T3GL43HDAFE4XKUGIENW4D5DDI.jpg)