
What's New With 529 Plans
During 2016, fees hit record lows, assets reached a new all-time high, and asset-allocation techniques improved.
/s3.amazonaws.com/arc-authors/morningstar/41940ba6-d0f1-493c-af96-52ad9419064e.jpg)
Within the landscape of 529 college-savings plans, fees have reliably fallen and assets have consistently risen. However, one new trend has emerged within age-based portfolios' asset allocation: smoother glide paths.
529 Plans Taking Lessons From Target-Date Funds Age-based options represent the most popular choice among 529 investors. These options' set-it-and-forget-it feature appeals to hands-off investors. Like target-date retirement funds, age-based portfolios aim to provide a well-diversified investment in one package. They do so by gradually reducing equities in favor of fixed income as the beneficiary ages. These age-based portfolios follow either static or progressive (commonly referred to as stepped or smoothed) approaches as they rebalance along the glide path. The former makes abrupt shifts from stocks to bonds at predetermined dates, often every few years close to a beneficiary's date of birth. Meanwhile, a progressive glide path uses smaller, more-frequent asset allocation adjustments, providing a smoother ride.
For example, the T. Rowe Price College Savings Plan uses a progressive process, readjusting its stock stake each quarter and targeting a less-than 6-percentage-point shift each year until college enrollment. At the opposite end of the spectrum, Tennessee's TNStars College Savings 529 Program employs a static approach. The plan's largest step occurs at age five, when it cuts equities by 35%, representing one of the largest single-day shifts in the 529 industry. Exhibit 1 illustrates the difference between these approaches.
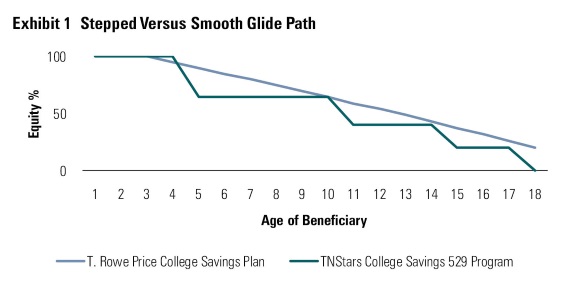
Source: Morningstar.
We favor the smoother method employed by progressive age-based options or a static approach that uses moderate steps. The static approach can introduce meaningful market risk if it makes a large asset-allocation change in one day, but our research has indicated that steps of roughly 10% or less largely mitigate this risk. For a deeper comparison of the approaches, refer to last year's 529 College Savings Plan Landscape.
All target-date funds that we cover follow a progressive approach, but the vast majority of 529 plans still use the static approach. Currently, 17 plans, which offer an aggregate of 25 age-based tracks, use the progressive approach. The remaining 67 plans, which together have 149 tracks, feature static age-based portfolios. Fortunately for investors, many plans that use static processes have recently smoothed their glide paths. Since the start of 2016, 15 plans have implemented or approved smoother glide paths for 41 tracks. This list includes plans from multiple program managers, including American Century, Ascensus, The Hartford, Union Bank & Trust, and Vanguard. Whereas these plans previously had step sizes as big as 50 percentage points, the largest asset-allocation shift after the changes will be 15 percentage points. Exhibit 2 depicts this trend. In most cases, plans achieved smoother glide paths by adding more age-based static portfolios to make the reduction in equities a more gradual process. This trend represents a meaningful improvement by the industry.
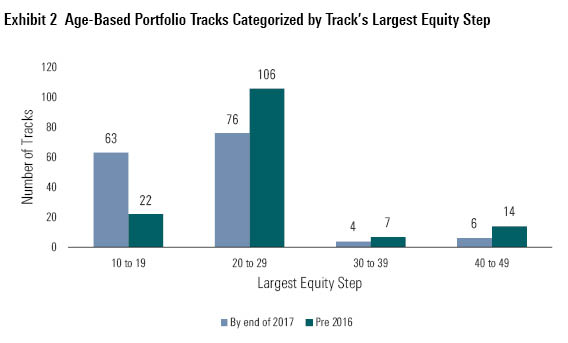
Source: Morningstar.
Fees Continue to Fall Fees on college-savings investments continue to trend downward. The simple average expense ratio for all 529 investment options decreased by 3 basis points during 2016 to 1.05% (this figure excludes money market funds, because most have significant fee waivers in place, as well as stable-value funds, which report inconsistent expense ratios to Morningstar's database.) This represents a slight improvement as compared with 2015, when the average fee fell by 2 basis points.
We place greater emphasis on asset-weighted expense ratios as compared with the simple average. The asset-weighted average represents a better measure of the total cost paid by investors, as a few outliers can skew the simple average. On an asset-weighted basis, the trend was similar during 2016. The asset-weighted fee for 529 investments fell by 4 basis points to 0.70%. Notably, that figure is 35 basis points below the simple average, demonstrating that investors have shunned expensive options in favor of cheaper ones.
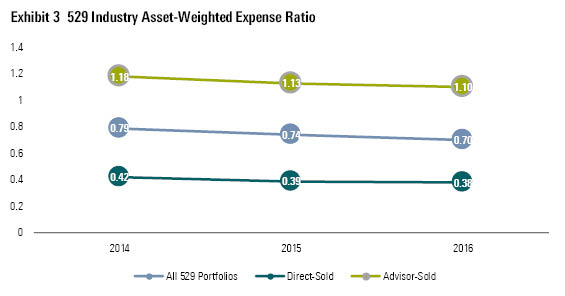
Source: Morningstar.
Since age-based portfolios carry the lion's share of 529 assets, we focus largely on these options' fees when determining Price Pillar ratings for 529 plans. To make an apples-to-apples comparison, we divide 529 age-based options into groups based on their distribution channel and underlying investment methods. After separating age-based options by direct- or advisor-sold plans, we categorize tracks into one of three groups: actively managed, passively managed, or a blend of the two. (A blend is defined as having between 20% and 80% in active management.) We then determine the average total expense ratio for each age-based track and compare it with similar peers. Exhibit 4 shows the averages as well as the 25th and 75th percentile fees within each group as of April 2017.
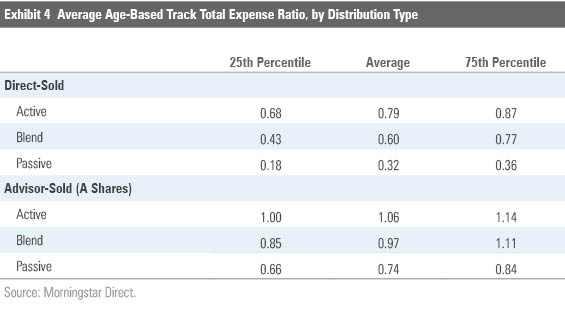
Notably, direct-sold plans cost considerably less than advisor-sold plans. Direct-sold plans make heavy use of index strategies, which provide low-cost exposure to asset classes and are generally easy to use. Advisor-sold plans use more actively managed funds and their expense ratios include compensation for advisors providing financial guidance.
In evaluating expenses, we also consider dollar-based maintenance fees that roughly half of 529 plans charge. The fees range from $10 to $30 a year, which may seem insignificant, but the typical 529 account balance stands at about $20,000. Thus, these fees translate to 5 to 15 basis points for the average college saver, which we consider to be material.
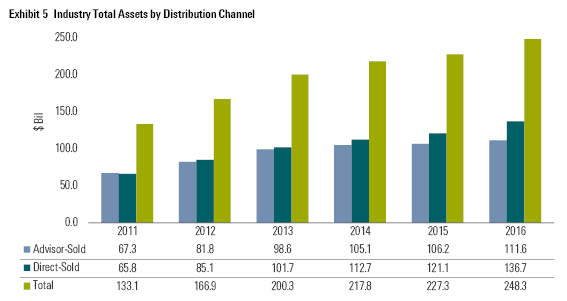
Assets Reach a Record High Assets in 529 college-savings plans continue to increase. At the end of 2016, 529 plans reached a record high of $248 billion in assets. That represents a year-over-year growth rate of 9%. Market appreciation explains most of the increase, with net new flows representing about 2% of the growth.
Source: Morningstar.
Advisor-sold plans extended their streak of losing market share to direct-sold plans in 2016. Six years ago, advisor-sold plans accounted for about 51% of the industry's assets, but that figure has steadily declined and now stands at 45%. Several factors explain this shift, including lower fees charged by direct-sold plans. At the end of 2016, the average direct-sold investment option carried an expense ratio of 0.45%, compared with 1.33% for advisor-sold portfolios. Direct-sold plans have also become more user friendly, offering robust and easy-to-use websites. Additionally, many advisors have moved to fee-based from commission-based compensation models. The former pays advisors based on assets under management, which gives them incentive to purchase lower-cost direct-sold plans for their clients.
The increasing size of the 529 industry has improved its scale and helped drive fees lower in 2016. Meanwhile, enhanced asset allocation techniques represent progress in the industry. Both factors will likely lead to better outcomes for college savers.
/cloudfront-us-east-1.images.arcpublishing.com/morningstar/ZKOY2ZAHLJVJJMCLXHIVFME56M.jpg)
/cloudfront-us-east-1.images.arcpublishing.com/morningstar/IGTBIPRO7NEEVJCDNBPNUYEKEY.png)
/cloudfront-us-east-1.images.arcpublishing.com/morningstar/HDPMMDGUA5CUHI254MRUHYEFWU.png)
:quality(80)/s3.amazonaws.com/arc-authors/morningstar/41940ba6-d0f1-493c-af96-52ad9419064e.jpg)