
Is the Housing Market Putting the Fed in a Box?
The impact of higher rates on housing affordability could give the Fed pause in its tightening plans.

This week, some initial housing data was released as well as news on industrial production. Monthly manufacturing data looked exceptionally strong. Even year-over-year data continued its slow and steady progress driven by an improving oil patch and increased use of electronic components in more common devices.
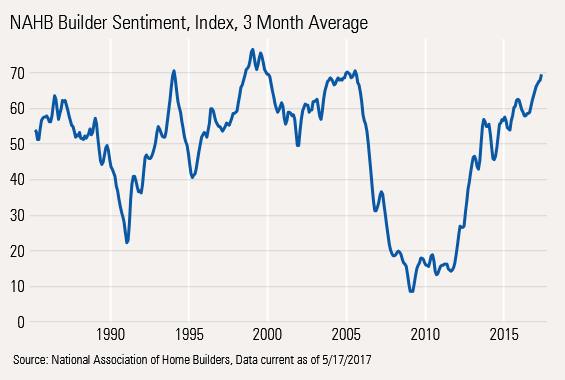
Builder sentiment looked strong, with a reading of 70, which should mean at least a few more good months, though we are concerned that the housing market has tended to peak at levels close to where we are now. Data on housing permits and starts continue to support our belief that housing will stay an important contributor to economic growth. However, a soft multifamily market and slightly softer single-family data suggest that housings contribution to GDP growth will be little improved, if any, from 2016's relatively small 0.2% contribution.
Perhaps more interesting is that the U.S. Federal Reserve's plans to hike interest rates by a quarter of a point three times per year could affect the housing market by more than the Fed might expect, potentially giving it pause. With three quarter-point rate increases (and assuming mortgages move proportionally), the same priced home will require a monthly payment that is close to 14% higher than it is today.
And if home prices continue to increase at a 6% annual pace, that increase could be 20% for the same home a year from now. Plus, if the Fed starts letting its portfolio of mortgages burn off, mortgage rates could move up even faster than the Fed Funds Rate. With housing data already looking toppy, this would not be welcome news.
The Fed also faces one other unusual paradox. By raising rates and stopping mortgage purchases, the Fed could cause new home construction to fall, decreasing potential supply. That in turn would likely cause existing-home prices and rents to rise, potentially increasing inflation. That isn't what the textbooks would normally suggest.
First Round of Housing Data Paints a Mixed Picture This week the Builder Sentiment Report from the National Association of Home Builders and the U.S. Census Bureau's report on housing starts and permits kicked off the flood of monthly housing data.
Builder sentiment was strong with a reading of 70, the second-highest reading of this recovery. The reading is also considerably above the 62 level of last May. We are guessing that lower mortgage rates, which are considerably lower than the beginning of the year, may be helping the sentiment data. However, it is at least a little worrisome that a reading of 70 or so is when housing markets peaked. Still, in the past two housing peaks, above-70 readings were maintained for a year or two before the collapse began in earnest.
In addition, while mortgage rates are down from 4.32% at the very beginning of the year (and March 2017) to 4.05% currently, rates are still up a lot from 3.57% a year ago and the October low of 3.42%.
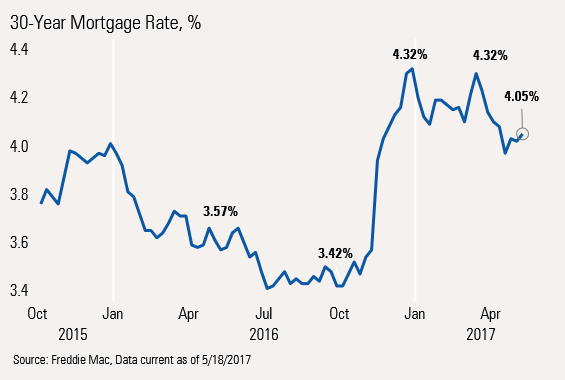
Mortgage Rates and the Housing Industry May Put the Fed in a Box If the Fed keeps raising rates--three or so times over the next year--mortgage rates could be pushing 5% a year from now. Even that relatively small move would push up mortgage payments by 15% on the same priced home.
However, with home prices moving up 6% on average, that monthly payment a year from now, on the same home, could be up over 20% (14% from higher rates, 6% from price appreciation), while incomes will be lucky to move up by 4%.
That is more than a little worrisome, which is why the Fed may be forced to act more slowly than it is currently expecting, or face a slumping housing market. And at a 5% rate, almost everyone who has gotten a mortgage since 2010 would be forced to buy a new trade-up home with a higher-priced mortgage.
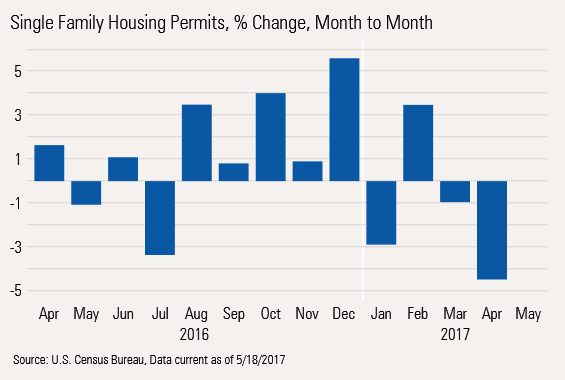
Single-Family Permits Continue to Grow Around 10% Annually, Despite Sickly Month-to-Month Readings Just as a quick reminder, we generally dispense with the housing starts data because starts are very weather-dependent and hard to measure because of the field observations needed.
Permits, which are filed in clean, dry government facilities, are less subject to this risk. And in most cases, permits proceed a start by a month or two anyway, making them a better forward-looking indicator. Also recall that we focus on the single-family market because the spend per unit and labor per unit is so much higher than the apartment building market (though this market is soft at the moment).
Month-to-Month Data Not So Great The month-to-month single-family data doesn't look great at the moment. However, month-to-month data is too volatile and is subject to seasonal distortions that make it close to worthless. Still these are often the numbers the media outlets latch on to.
Rolling 12-Month Year-Over-Year Data Looks Better, At Least for Single-Family Homes Below is a graph of year-over-year, rolling 12-month data that we believe effectively get rid of most weather, special tax incentive, and quirky seasonal factors.
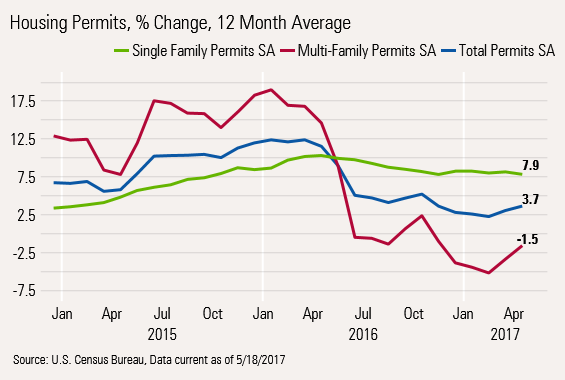
Multifamily Housing Slump Continues As we have noted many times before, the once-robust multifamily market has slowed dramatically, which will likely depress 2017 residential construction data used to calculate GDP growth.
The apartment market is having saturation issues in some large markets, and demographics are growing increasing unfavorable for this market. Given a much greater lag between permits and starts, and also completions in the multifamily market, multifamily construction dollars are likely to fade for another year or more.
Single-Family Market Stabilizes Below Peak Growth Rates The single-family market looks much healthier, with more stable growth that is trending around 8%. The three-month year-over-year data, though more volatile, is also running at 8% growth, but is a little further from its recent highs. In any case we don't see many signs of acceleration, which will likely keep housing prices moving higher, because of a relative lack of supply.
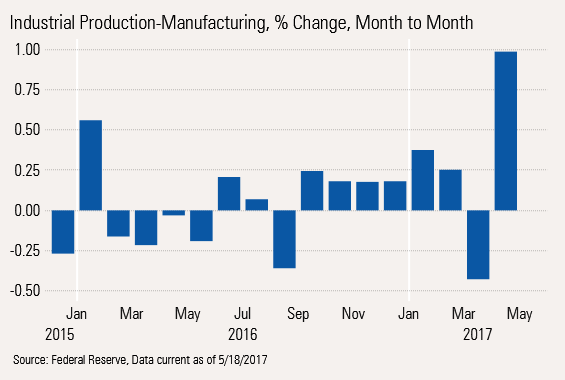
Palpable Manufacturing Excitement in April; Longer-Term Data Moves Up at a Glacial Pace Month-to-month manufacturing data made a big leap in April, with manufacturing production jumping 1% in a single month. As many breathless commentators were quick to point out, that was the best performance since 2014.
However, the strong April number is likely payback for a weak March that was down almost 0.5%. Note that months with a lot of business days, like March, tend to look worse than months like April, which have fewer business days.
Nevertheless, seven of the 10 largest categories were up significantly for the month, versus just 2 to 5 categories in the last six months. Better breadth is usually a very positive sign.
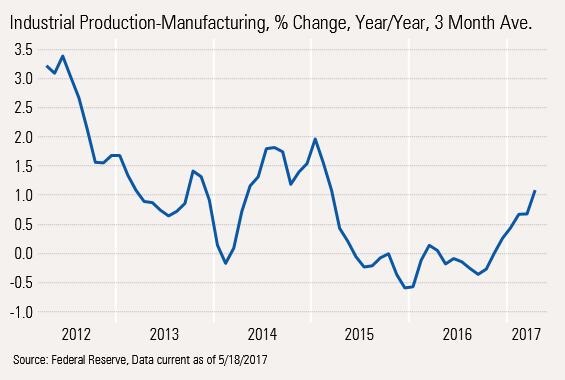
The year-over-year averaged data is also now well into the black, with the data moving from a low of negative 0.5% in late 2015 to just over 1%. New orders and single-month data suggest full-year growth could move up to 2% or more. Even the long-term average of 2.4% growth appears to be within reach.
However, 2% Manufacturing Growth Isn't a Sure Thing Although the April breadth was strong (seven of 10 largest categories up), the rolling 12-month data still shows just four categories in growth mode: computers and electronics, food, machinery, and motor vehicles.
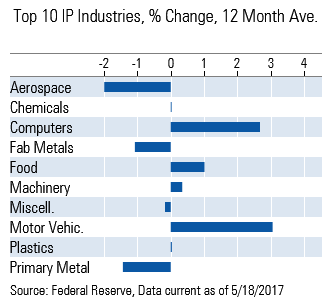
Furthermore, motor vehicle production is likely to slow further given the current inventory glut of unsold sedans. Still, based on more recent months, we think that the food and machinery categories have some potential to improve, at least if oil prices remain stable and agricultural raw materials remain cheap. We also don't see the computer/electronics sector slowing, at least for now. Technology stock prices generally have strongly reflected this trend.
/cloudfront-us-east-1.images.arcpublishing.com/morningstar/MNPB4CP64NCNLA3MTELE3ISLRY.jpg)
/cloudfront-us-east-1.images.arcpublishing.com/morningstar/F2S5UYTO5JG4FOO3S7LPAAIGO4.jpg)
/cloudfront-us-east-1.images.arcpublishing.com/morningstar/7TFN7NDQ5ZHI3PCISRCSC75K5U.png)