
Under the Surface, a Ho-Hum April for Employment
More than a million nonseasonally adjusted new jobs is actually nothing special, and the quality of the gains was quite poor.

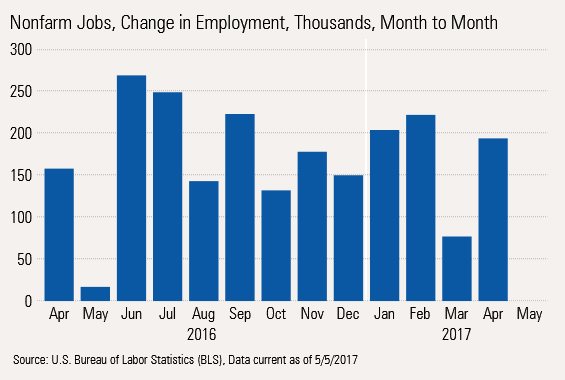
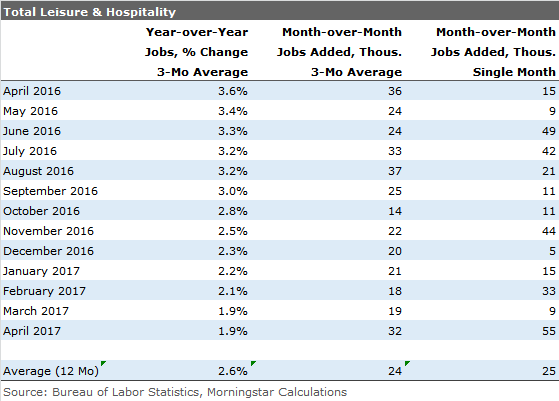
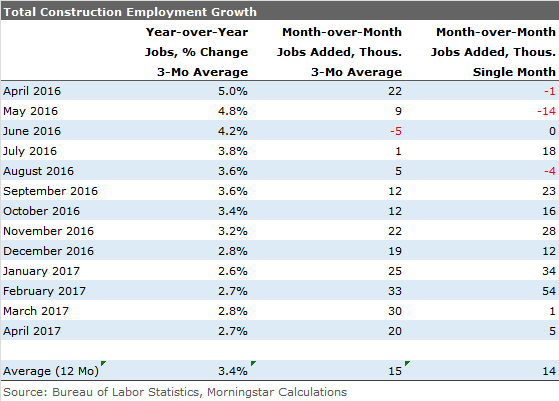
Despite some eye-popping nonseasonally adjusted job gains reported in April (over 1 million jobs), the seasonally adjusted job gains were nothing special at 211,000. That gain, though beating the consensus forecast, was one of the lowest-quality reports we have seen in some time. The low-wage leisure and hospitality sector led the way, with gains of 55,000. Higher-wage goods-producing jobs slowed during the month.
The news outside the employment sector wasn't great, either. Motor vehicle sales continued to slow, and unit sales on a seasonally adjusted, annual rate basis remained below 17 million units. Construction spending also contracted in March after some decent gains earlier in the year. Purchasing manager data in April for manufacturing also dropped, finally mirroring some of the slower manufacturing employment numbers and order data.
Nonseasonally Adjusted Employment Data Not as Good as It Looks On a nonseasonally adjusted basis, the economy added what appears to be a stunning 1.03 million jobs. Unfortunately, that is relatively normal for April. In fact, it is a tad below normal as employment growth, nonseasonally adjusted, has averaged 1.10 million. April is almost always the best-performing month for employment as school comes to a close, the weather warms, and normal preparations for summer begin.
Doing the necessary seasonal adjustments, April 2017's job growth was a more normal-looking 211,000 jobs. So how did almost 800,000 jobs get adjusted away? Despite the large size, the adjustments do make some logical sense. The job gains that are adjusted away are the usual suspects: leisure and hospitality, construction, services to buildings (landscapers, I assume), and building material stores. These four simple categories account for 80% of the adjustments. Leisure and hospitality (summer seasonal hiring for tourist attractions, hotels, and restaurants) accounts for 40% of the massive seasonal adjustment in April.
Many of these jobs will start going away in July, and the seasonal adjustment factor flips the other direction as lots of those seasonal jobs come to an end. The negative adjustment for July is even larger (but in the opposite direction).
Why do we bring this up? These adjustments are huge--in some months dwarfing the level of hires--so relying on month-to-month, seasonally adjusted data becomes folly. Furthermore, in some years, spring comes a month or two early and sometimes a month or two late, but the seasonal adjustment factors are already cast in stone from 20 years of average data.
That is why we prefer year-over-year data, averaged over three months to steady the employment picture. One reason to bring up this discussion now is because the leisure and hospitality sector was responsible for the upside surprise in the April employment data.
With that said, we will take a quick look at the month-to-month data, and then come back to our more traditional year-over-year analysis. The short story is that employment growth remains relatively lethargic through a combination of lack of workers in some sectors and not enough job offerings in others.
With nonfarm payrolls growing just 1.6%, it will likely prove difficult to increase GDP by much more than 2%. Also, consumption, a key driver of GDP growth, is likely to suffer as the gap between inflation and hourly wage growth has closed. The results aren't likely to be catastrophic, but it will be difficult, if not extremely difficult, for GDP to grow faster than 2% in 2017.
Month-to-Month Employment Rebounds From Temporary Slump At 211,000 jobs added in April, the report surpassed the consensus estimate of 200,000, our estimate of 180,000 jobs, and the 12-month average of 182,000 jobs. This was a respectable performance following disappointing job growth of just 79,000 in March.
The Month-to-Month Job Growth Was of Exceptionally Low Quality While the headline number pleased many, we saw little to like here. First, 55,000 of the job gains came from the low-paying low-hour leisure and hospitality sector. Jobs in that sector pay less than half of what the best sectors do and provide less than half the weekly hours of the best sectors.
Meanwhile, after two stellar months (January and February), the high-paying construction sector fell back to earth in March and April. Also worth noting is that the year-over-year data has stabilized at 2.7% growth. While that is still above the economy overall, it is well below recent highs.
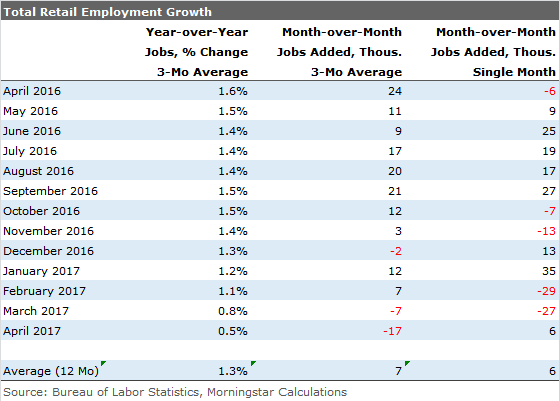
Retail Death Spiral Pauses, at Least for Now
Retailers that face ongoing pressures from
In sum, the month-to-month data wasn't nearly as benign as most pundits are assuming.
Year-Over-Year Job Growth Stuck in Neutral at Best We publish the year-over-year employment growth graph each month with the release of the employment report. We caution that we truncated the bottom of the graph at 1.6%, to more easily see the trend. It does overly dramatize the decline. Still, a fall from 2.5% growth to 1.7% growth (private sector only) is nothing to dismiss. The good news is that the worst of the slowing may be behind us.
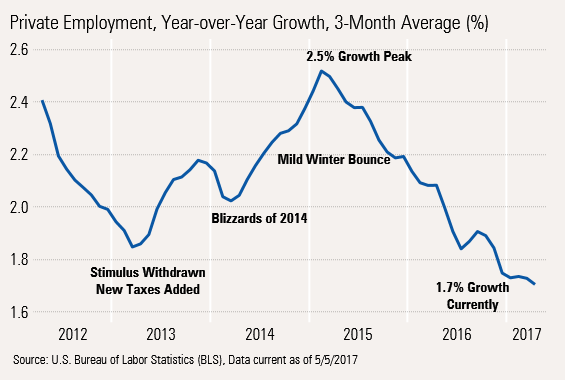
In the year-over-year data, the slowing growth is not only primarily due to the slowing in the relatively large retail sector, but also from the leisure and hospitality sector, which, despite a great improvement from March to April, has seen year-over-year growth drop from 3.5% to just 2.0%. About the only sector showing a strongly accelerating trend is the business and professional service category.
Wage Growth Acceleration Takes a Pause Average hourly wage growth on a three-month moving-average basis accelerated smartly from 2.0% at the end of 2014 to 2.75% in December 2016. However, that average dropped back to 2.65% in April (and just 2.5% on a single-month, unaveraged basis).
Part of that is likely a mix shift revolving around low- and high-paying industries. It also has to do with demographics, as highly paid baby boomers retire and are replaced with younger and cheaper workers (if they are replaced at all).
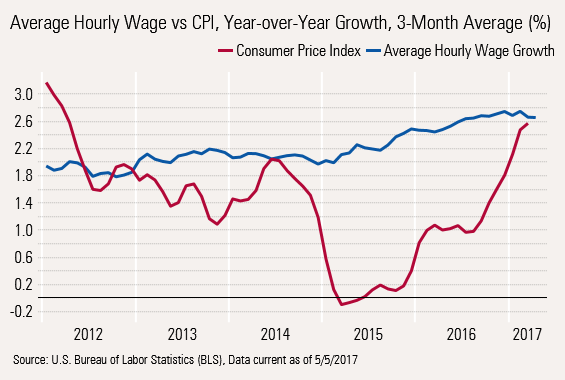
Shrinking Wage and Inflation Gap Is Alarming The blue wage line above is mildly concerning. Though that trend is relatively mellow and has a few potential explanations. More worrisome is the red inflation line that continues to edge higher. That leaves less money in consumers' pockets to spend. It is not coincidence that retail sales had one of their best runs when that gap was the widest and have slowed since the gap has begun to close. One of our key projections for 2017 was that consumption growth would slow as this gap closed, also limiting GDP growth improvement.
While many economists blew off soft consumption in the first quarter as a utility-related anomaly, that is not the whole story, in our opinion. A smaller wage/inflation gap and stagnant Social Security payments will continue to inflict damage on medium-term consumption data, even if consumption manages a small bounce in the second quarter.
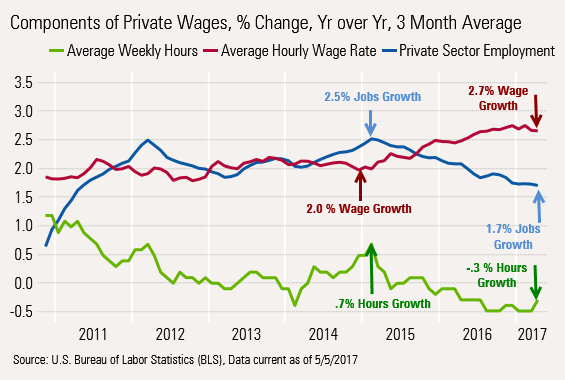
At Least Hours Worked Are Beginning to Improve On a month-to-month basis, average hours increased from 33.3 to 33.4, and year to year, single-month hours growth was flat. As changes in hours worked are often precursors to employment changes, we are pleased to see some improvement in hours worked. However, the improved three-month moving average data still shows a 0.3% decline. The three key drivers of total wage growth are shown below.
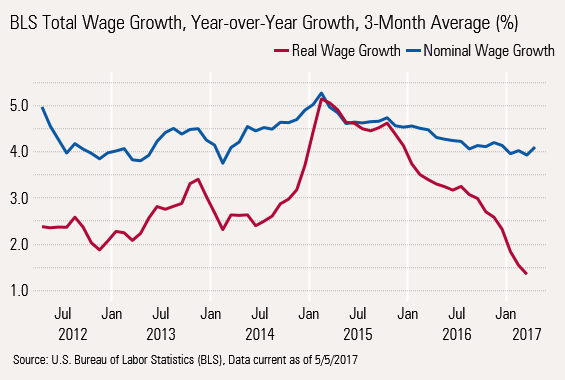
Total Nominal Wages Exceptionally Stable While Total Real Wage Growth Sliding Fast Rolling together employment growth, hourly wage growth, and hours worked provides one measure of total wage growth. As represented by the blue line below, that growth hasn't budged much from its 4% anchor since 2012. However, total inflation (headline CPI data) adjusted total wages have shrunk from an unsustainable high 5% rate (due to deflation) to just 1.4% as inflation has returned to normal levels. The results look less dire if we use PCE deflator, which is less volatile than the CPI.
Indeed, Consumption Data Hasn't Been Great
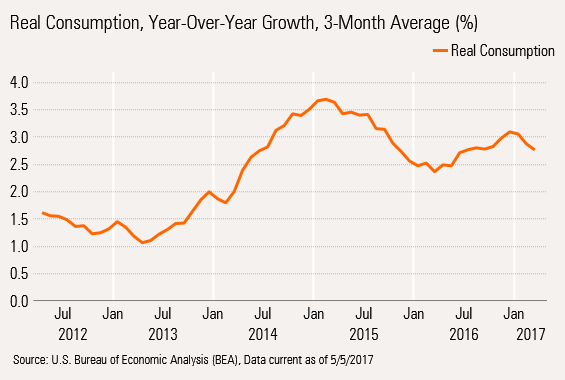
Even with an artificially inflated March number (falling month-to-month gasoline prices skewed the inflation adjustment) consumption still looks like it is slowing. It is also interesting to note that consumption growth peaked at the same time as real wage growth did.
Poor auto sales data for April, released this week ...
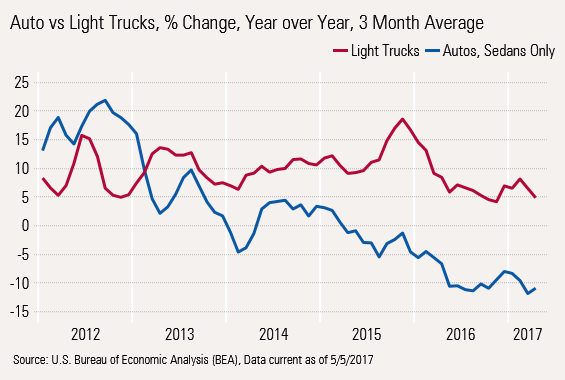
... along with a return to more normal inflation rates suggest consumption will be under even more pressure in April. Unfortunately, consumption data is reported a full month behind the more current employment data.
/cloudfront-us-east-1.images.arcpublishing.com/morningstar/T5MECJUE65CADONYJ7GARN2A3E.jpeg)
/cloudfront-us-east-1.images.arcpublishing.com/morningstar/VUWQI723Q5E43P5QRTRHGLJ7TI.png)
/d10o6nnig0wrdw.cloudfront.net/04-22-2024/t_ffc6e675543a4913a5312be02f5c571a_name_file_960x540_1600_v4_.jpg)