
Three Shades of Value
The different methodologies used by value funds can affect their style tilt and performance.
/s3.amazonaws.com/arc-authors/morningstar/78665e5a-2da4-4dff-bdfd-3d8248d5ae4d.jpg)
A version of this article appeared in the April 2017 issue of Morningstar ETFInvestor.
Value investing has long been associated with excess rates of return. Generally speaking, a value-oriented approach involves buying stocks that are cheap according to some measure of intrinsic value in hopes that they will one day revert to their fair value. But that day may be a long time in coming--if it ever comes at all. Patience is a requirement, and the past decade has tested the strongest advocates of value investing. For the 10-year period through December 2016, the Russell 1000 Value Index underperformed the broader Russell 1000 Index by almost 1.5 percentage points annually. Adding insult to injury, it was also more volatile and suffered deeper drawdowns during the depths of the global financial crisis.
By measure of the same Russell indexes, value continued to have a difficult time as it emerged from its postcrisis nadir. From March 2009 through December 2016, the Russell 1000 Index again outpaced the Russell 1000 Value Index, in this instance by 16 basis points annually. That's not a huge difference, but it's notable considering value strategies are associated with higher expected returns. However, drawing the conclusion that all value strategies underperformed during this period would be shortsighted. Not all value strategies are created equal.
Large-cap value funds are plentiful in the United States, and many of them are actively managed. Here, I'll look more closely at a select subset of funds within the large-value Morningstar Category. My sample is dominated by index-tracking ETFs with at least 10-years of returns. I've also included
A quick review of this group shows that some have indeed outperformed the broader U.S. stock market in the postrecession bull run. From March 2009 through December 2016, 10 of these funds beat
To investigate this further I ran a four-factor regression using data from the French Data Library.[1] The factors considered in this study were market (beta), size (small minus big, or SMB), value (high minus low, or HML) and profitability (robust minus weak, or RMW). The outcome of this analysis helped me place the funds in my sample into three different subcategories: deep value, value plus profitability, and mild value.
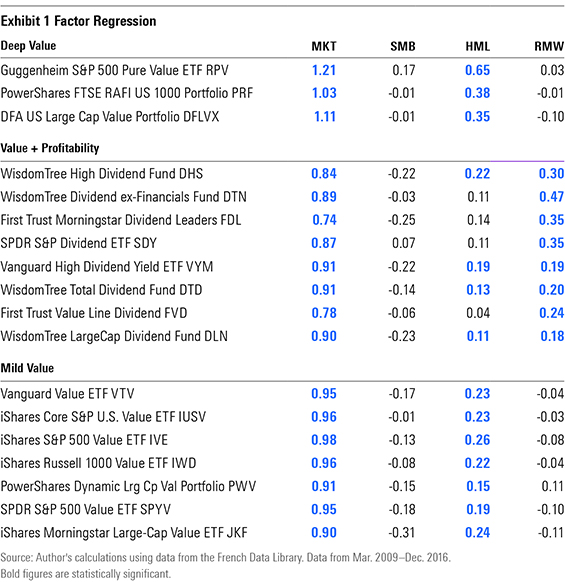
Deep Value Funds that were classified as deep value had the heaviest loadings on HML. The regression results in Exhibit 1 show that these funds have offered the purest exposure to value, with HML coefficients of 0.3 or larger. Each of the three uses different construction and weighting methodologies, but there are some similarities. All tend to have overweightings in the smallest and cheapest companies in their respective selection universes. These weightings are based on several fundamental metrics such as price/book, price/earnings, and price/sales.
These funds own the cheapest of the cheap stocks. Rebalancing into ultracheap shares at the market's lowest point helped these funds outperform VTI in 2009 as the recovery got under way. DFA U.S. Large Cap Value,
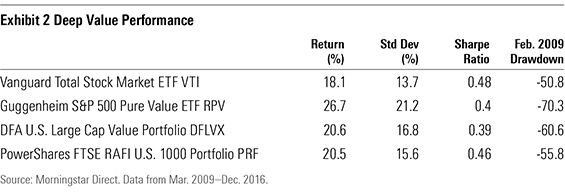
The excess returns generated by these strategies didn't come easy. These funds had some of the deepest drawdowns during the market downturn in early 2009. RPV was down from its nearby peak as much as 70% in February 2009 compared with 51% for VTI. As the recovery progressed, these deep-value funds continued to be among the most volatile in the category. Their standard deviations and betas were among the highest of any of the funds included in this study.
Value Plus Profitability The other group of value funds that has outperformed the broader market in the postcrisis period featured lower value loadings than the deep-value ETFs but had exposure to the profitability factor (RMW). Profitability is sometimes used as a proxy for a firm's quality. Many of these funds follow indexes that either screen or weight their holdings on the basis of their dividend payments or yields.
Dividend strategies can cue off measures that may also be indicators of value (dividend yield) and/or profitability (dividend stability or growth). All things being equal, when a company is profitable it may increase the dividends it pays to shareholders. In this instance, a higher dividend payout may signal management's confidence regarding future profitability. On the other hand, dividend yields increase when a stock's price declines. This could result from a slump in a firm's prospects. Thus, a strategy that emphasizes dividends may buy companies that are increasing dividend payments (profitability), those that have experienced recent slump (value), or some combination of the two.
The major benefit of having a portfolio exposed to both value and profitability is that these two strategies can diversify each other. In his paper "The Other Side of Value: The Gross Profitability Premium,"[2] Robert Novy-Marx demonstrated that value and profitability strategies are negatively correlated. Value strategies purchase stocks of companies that are on the ropes, while strategies based on measures of profitability tend to invest in firms with rosier prospects. Therefore, when one strategy is doing poorly, the other is likely performing well.
All the funds I've assigned to this subcategory had a statistically significant loading on the profitability factor. These same funds had value loadings that were lower than those of the deep-value funds. The inclusion of profitable firms helped these funds outperform the broader market from March 2009 through December 2016.
Monetary policy in the postrecession period provides an additional explanation of outperformance. In late 2008, the Federal Reserve began cutting interest rates intending to jump-start economic growth and promote investment. Yields on bonds consequently dropped, leaving investors looking for alternative sources of income. The increased demand for higher-yielding investments was a likely contributor to the excess returns that dividend paying stocks generated relative to VTI.
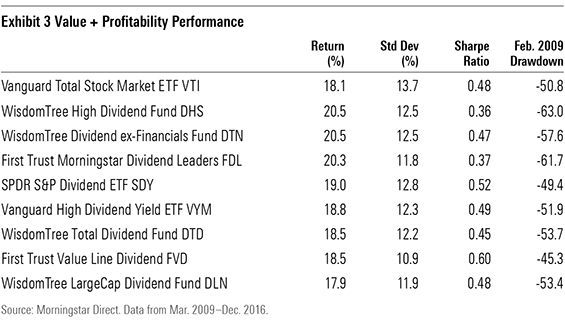
The marriage of value and profitability also resulted in a smoother ride relative to the deep-value funds. The emphasis on profitability, or quality, produces portfolios with lower betas, ranging between 0.7 and 0.9, indicating they've been less sensitive to movements in the broader market. This was likely because of a disparity in sector allocations, which align with the dividend focus. Compared with VTI, these funds were had overweightings in traditionally more defensive sectors such as utilities and consumer staples and underweightings in the technology and financial sectors.
Mild Value The remaining value funds in our field of study underperformed VTI during the postcrisis period. Similar to the deep-value group, these funds offered relatively pure exposure to the value factor. What distinguished these funds from their deep-value peers was the strength of their value tilt. Their loading on the value factor (HML) was lower than the deep-value funds'. Consequently, they didn't take advantage of the values on offer during the depths of the bear market in early 2009 to the same extent that the deep-value funds did.
These funds' mild value tilt springs forth from the build of their underlying benchmarks. Many of these mild-value funds' bogies are paired off against a complementary growth portfolio. The approach starts with a broad large-cap universe such as the S&P 500 or the Russell 1000 Index. Stocks in each of these indexes are assigned value and growth scores, then sorted and allocated into either a value or growth portfolio. All stocks in the parent index are accounted for. Therefore, the value and growth portfolios will include a number of stocks that have only mild growth or value characteristics. The inclusion of these additional stocks ends up watering down their respective growth or value tilts.
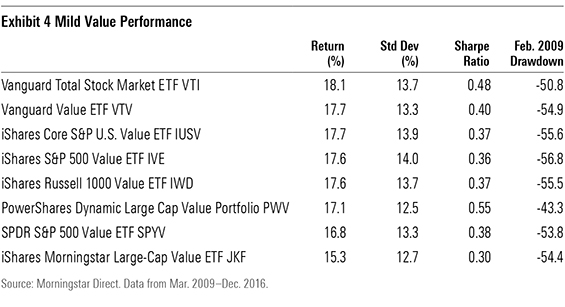
The most unfortunate aspect of these funds was their failure to compensate investors for the higher levels of risk. With the exception of
The conclusion here is that value funds come in many different flavors. Understanding how a value portfolio is constructed, and the exposure that it provides to the desired style, is an incredibly important aspect of using these funds. Each of these three shades of value provides a different approach to value investing. Funds that tilt more aggressively toward value may provide higher returns, but investors should take time to consider the trade-offs between risk and reward.
[1] Data from the Ken French Data Library, see Fama/French 5 Factors (2x3). http://mba.tuck.dartmouth.edu/pages/faculty/ken.french/data_library.html.
[2] Novy-Marx, R. 2012. "The Other Side of Value: The Gross Profitability Premium." http://rnm.simon.rochester.edu/research/OSoV.pdf.

Disclosure: Morningstar, Inc. licenses indexes to financial institutions as the tracking indexes for investable products, such as exchange-traded funds, sponsored by the financial institution. The license fee for such use is paid by the sponsoring financial institution based mainly on the total assets of the investable product. Please click here for a list of investable products that track or have tracked a Morningstar index. Neither Morningstar, Inc. nor its investment management division markets, sells, or makes any representations regarding the advisability of investing in any investable product that tracks a Morningstar index.
/d10o6nnig0wrdw.cloudfront.net/04-18-2024/t_34ccafe52c7c46979f1073e515ef92d4_name_file_960x540_1600_v4_.jpg)
/d10o6nnig0wrdw.cloudfront.net/04-09-2024/t_e87d9a06e6904d6f97765a0784117913_name_file_960x540_1600_v4_.jpg)
/cloudfront-us-east-1.images.arcpublishing.com/morningstar/T2LGZCEHBZBJJPPKHO7Y4EEKSM.png)
:quality(80)/s3.amazonaws.com/arc-authors/morningstar/78665e5a-2da4-4dff-bdfd-3d8248d5ae4d.jpg)