
First-Quarter GDP Curse Continues
Economic growth fell short, but it could have been worse.

This week's report will focus on the details of the first-quarter GDP report of just 0.7% growth. It wasn't as bad as some headlines suggested or easily brushed off as a statistical anomaly, as some economists have proposed. What we see is more sluggish but not disastrous growth rates in the quarters ahead, with full-year 2017 GDP growth likely to fall in the 1.75%-2.0% range.
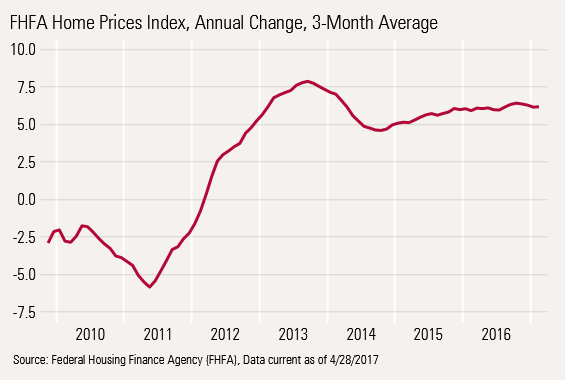
In other reports, new home sales set a new recovery high, although some of that increased interest is coming at the low end of the market. In other housing news, home price data released this week by the FHFA showed steady appreciation at a 6.2% year-over-year growth rate. That rate has failed to drop the way most pundits had predicted. The most notable part of the report was that home price appreciation is now accelerating in many parts of the country that were previously left out of the housing rebound, including those of us living here in Chicago.
On a separate note, corporate earnings are looking quite good, with many bellwethers doing well. Overall, first-quarter-over-first-quarter S&P 500 earnings are now looking like they could exceed 12%, the best performance since 2011. However, we caution that a good deal of the recent improvement is from the oil sector. Excluding oil, things are better, but perhaps not as good as the headlines suggest.
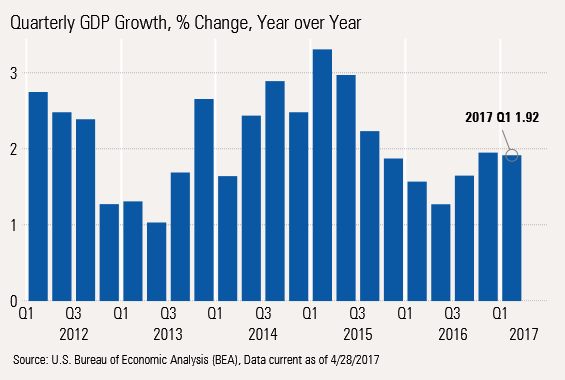
First-Quarter GDP Curse Continues as Growth Falls Short; Still, It Could Have Been Worse Overall, GDP growth on a sequential, annualized basis was a meager 0.7%, compared with 2.1% growth in the fourth quarter and expectations of about 1.2% when we published our column last week. Nevertheless 0.7% exceeded the dour 0.2% forecast from the Atlanta Fed's GDPNow model. The sequential, annualized growth rate is the most common way the media reports GDP growth.
Before we spill all the gory details, a quick CliffsNotes version of the report: The sequential quarterly data for the first quarter was weak, as it often is for statistical and weather-related issues. Only business investment-related categories and housing did well, while the consumer, inventories, and government all turned in rotten sequential results.
However, using our preferred year-over-year growth methodology, it was more of the same lethargic growth that continues to vacillate in the 2% range. Trends across most categories were little changed using the year-over-year lens. The two exceptions were government spending, which took a decided turn for the worse, registering a year-over-year decline, and business investment spending, which has improved quite dramatically for two quarters in a row. However, we caution that a dramatic bounce in oilfield-related spending is responsible for the improvement and not a groundswell of new business spending.
The report does nothing to change our outlook for continued slow growth of 1.75%-2.0% for both 2017 and 2018. Consumption will continue to be pressured by those on fixed incomes and even by wage earners who are seeing more of their wage dollars eroded by worsening inflation. We continue to believe that potential new government policies will be slow in coming and potentially have features that will help as well as hurt the economy. Any benefits, even a tax cut could prove to be short term, as demographic headwinds would likely prove exceptionally difficult to overcome.
Now let us turn to the details of the GDP report.
Sequential GDP Growth Flounders Yet Again
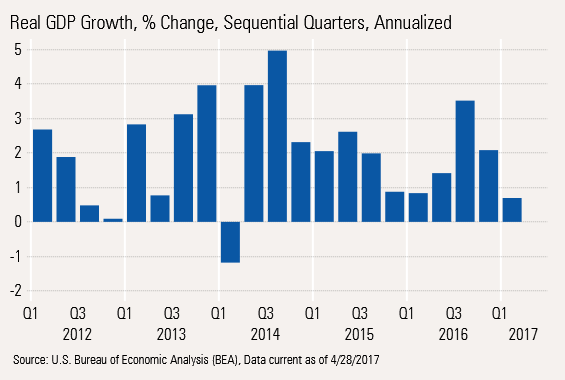
We have been ranting and raving about statistical issues in the widely quoted seasonally adjusted, annualized, sequential quarterly growth for the past five years. The problems in the first quarter are particularly acute, as even the best seasonal adjustments can't take into account warmer- and colder-than-normal weather.
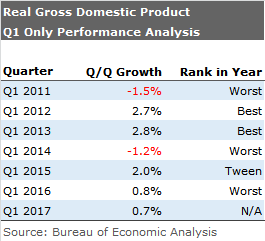
Although the U.S. economy was clearly in recovery mode, two of the previous six first quarters showed negative GDP growth (the only ones of the recovery), and in three cases, the first quarter was the worst-performing of all of the four quarters.
The track record for the first quarter would have been even worse if the government hadn't tweaked the seasonal factors a bit last summer in a major GDP revision. Still, the first quarter was the best-performing quarter in two of the years, so it is not quite as much of a one-way street as some economists are suggesting. In fact, after years of taking first-quarter whiffs too seriously, we think the analysts are entirely too complacent.
First-Quarter Data Is Often Jinxed, but Not Always
This year's first-quarter data had some unusual quirks that both helped and hurt sequential first-quarter results.
Unusually warm weather hit utility usage (reflected in consumer services). Motor vehicle sales also had a rough quarter, subtracting from GDP, which is likely due to faulty seasonal factors. Still, we believe autos could be problematic in future quarters, too, because of saturation issues.
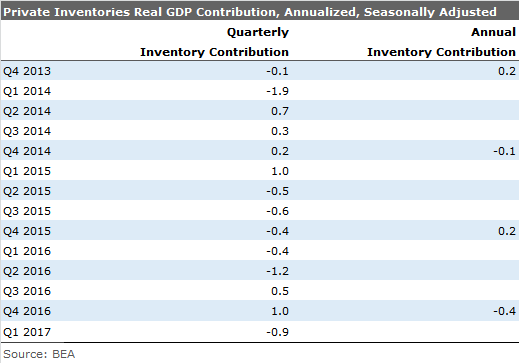
Inventories were also a large detractor from the quarter. Over the course of a year, those quarterly inventory adjustments tend to cancel each other out. Though, 2016 was a rare exception where the inventory adjustment didn't quite make it back to zero. Still, potential inventory additions instead of subtractions appear to be the most likely case for the rest of 2017.
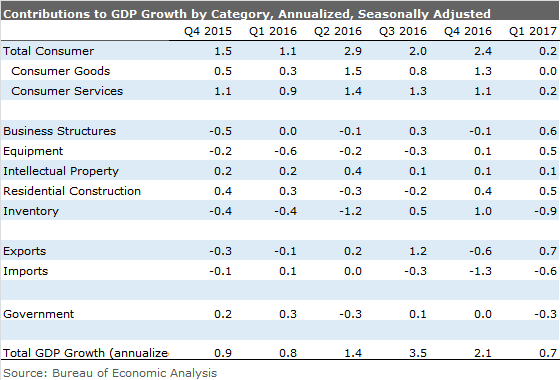
On the other hand it was a great, and likely unsustainable, quarter of growth for business investment on a sequential basis (year-over-year results were good, too). The classic business investment categories, business structures, equipment, and intellectual property, contributed 1.2% to GDP growth, one of the best performances of the entire recovery. However, oil well structures accounted for half of that contribution after some jaw-dropping subtractions in 2015. We would also guess that oilfield equipment contributed about 0.2% of the 1.2% contribution from business investment spending. Without the oil-related improvements, business investing spending would have contributed just 0.4% to GDP growth. Therefore, the monster investment quarter was rather one-dimensional. Business spending on structures, other than oil wells, showed no growth at all. Spending on manufacturing structures was down for the quarter.
Poor Consumption Growth Brushed Off Too Casually for Our Liking Consumption, at about 70% of GDP, has been a key contributor to GDP and has topped the leaderboard for most quarters since 2012. That didn't happen this quarter, as consumption grew less than 0.3% annualized, and contributed just 0.2% to GDP growth in the first quarter.
Most economists are blowing that off as a fluke driven by warm weather. (Poor utility sales likely reduced GDP by 0.5% or more. Clothing sales were also strongly affected.) Motor vehicle sales also took 0.5% off of GDP growth, which most blame on statistical issues.
However, we don't believe that is the end of the story. Real disposable income, the fuel for consumption growth, grew only 1% on a sequential, annualized basis in the first quarter, following 2.0% growth in the fourth quarter and 2.5% for all of 2016. That pronounced downturn has not received the attention it deserves as time-pressured economists grab at the bigger, more obvious excuses.
And if consumers faced smaller utility bills for a very large portion of the winter, not just one good month, one might have expected that spending in some other categories would go up as a result. The truth is, they didn't. Restaurant sales, often a key marker for consumer spending attitudes and often a beneficiary of warm weather, grew at a very humdrum 1.4% annualized rate. We will take a more detailed look at consumption when the more detailed, month-by-month consumption data is released.
Year-Over-Year GDP Data Paints a Better Picture but No Boom Comparing the current quarter with the same quarter a year ago showed growth of 1.9%, which sounds a lot better than the 0.7% annualized sequential data. And the year-over-year growth bars are no longer falling like rocks as they did for most of 2015. Growth has been clustered around 2% for a year, suggesting a solid baseline trend of just under 2%, in line with our full-year forecast.
Crudely Measured, Productivity Is Picking Up Steam As it turns out, one of the better features of the first-quarter GDP report was that non-government-related GDP grew at just over 2% on a rolling four-quarter basis, better than our most recent thoughts, as business investment did better; government, quite a bit worse. Plotting GDP--a production measure--against hours worked (number of employees multiplied by the average hours worked) gives us a very crude measure of productivity.
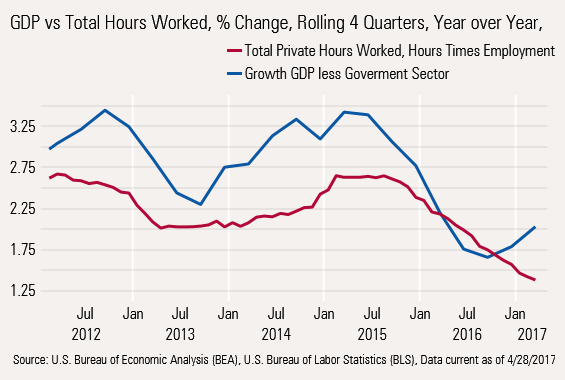
While not always large, GDP grew faster than average hours worked for most of the recovery. As GDP growth slowed quickly and unexpectedly in 2015, employers did not cut back hours or employees quite as fast (which is very typical). Now with employers, especially in retail, cutting back and GDP growth rates (on a rolling four-quarter year-over-year basis), GDP growth of over 2% is handily outpacing growth in hours worked growth of just 1.4%, a spread of 0.6%. While not huge by historical standards, the spread has averaged 0.5% since 2012. Given that the GDP tends to drive employment growth, we suspect the worst of the employment growth slowing is behind us, unless GDP takes another turn for the worse.
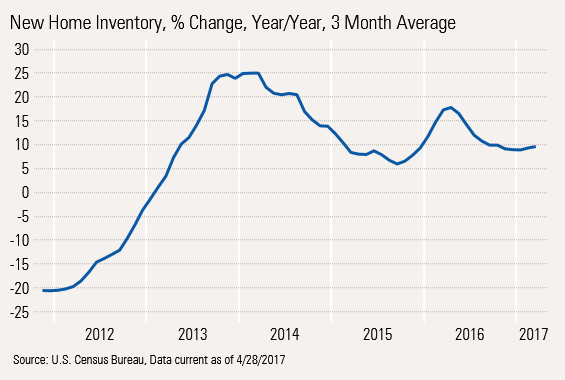
New Home Sales Continue to Power Ahead Residential investment was one of the rare bright spots in the first-quarter GDP report, contributing 0.5% to GDP growth, which is modestly above recent averages. New home sales are a very important component of the overall residential investment. It focuses mainly on tract homes, and not individually commissioned custom homes or volatile, low-value-added apartments.
The data on this front released this week was excellent. New home sales set another recovery high, and month-to-month growth continues to look robust if still a bit lumpy.
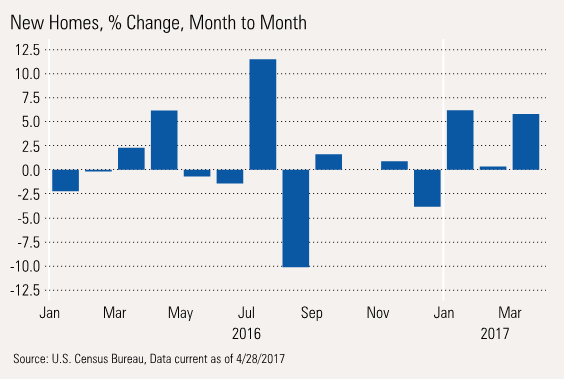
The year-over-year, three-month average takes out some of those lumps and still looks quite robust. As mortgage rates have fallen again and weather has been favorable, new home growth rates are turning up again after a brief stall at the very end of 2016.
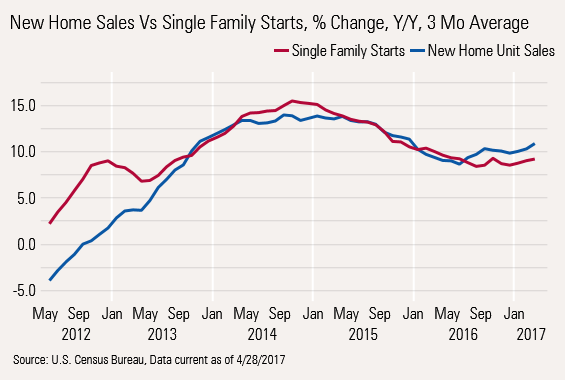
Unlike existing homes, inventories of new homes are building, providing the fodder for sales growth. Buyers seemed to be anxious to get into a new home as a greater-than-usual number of homes sold were fully completed and standing empty (versus partially completed or lots with no home started). That should keep housing starts moving ahead. However, potential tax law changes eliminating the deduction for property taxes could weigh on markets if this comes to fruition.
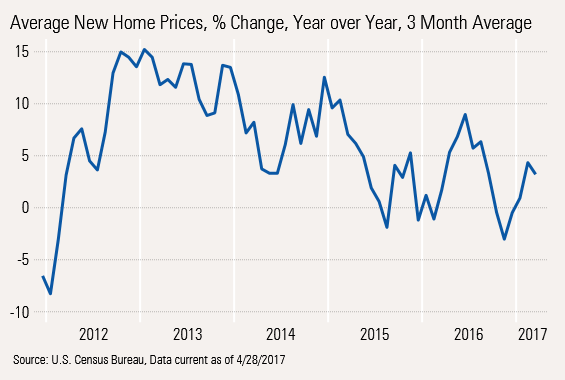
Interest in Lower-Priced Homes Seems to Be Building During most of the recovery, builders have focused on putting bigger houses on lots to maximize profits. This caused the average price of a new home to substantially exceed building costs and general home price indexes. Though the lines wobble some, the peaks in price growth rates and the troughs in average new home transactions are trending down. At less than 5% currently, that is well below production cost growth, interest is clearly building at the low end of the market. That is great news for younger buyers, perhaps not quite as good news for builders and the GDP calculation (that counts inflation-adjusted dollars, not units).
Existing-Home Prices Still Increasing at a High Rate With Those Tight Inventories Year-over-year price indexes are up about 6.2%, up from sub-5% level of 2014 but still comfortably below the 7.6% rates of mid-2013 that stalled the existing-home market.
Frankly, price appreciation doesn't appear to have changed much over the past year, at least on the surface. However, home-price increases once concentrated in the West, Pacific Northwest, and Southwest have spread to the East and the Midwest, including many Rust Belt states. Cities like Chicago and Detroit have seen their price growth shoot above national averages. Meanwhile, some markets like the Bay Area in California have seen a rather dramatic slowing in price increases. We believe that this evening out of price increases may be one reason consumer sentiment data has looked so much better.
/cloudfront-us-east-1.images.arcpublishing.com/morningstar/T5MECJUE65CADONYJ7GARN2A3E.jpeg)
/cloudfront-us-east-1.images.arcpublishing.com/morningstar/VUWQI723Q5E43P5QRTRHGLJ7TI.png)
/d10o6nnig0wrdw.cloudfront.net/04-22-2024/t_ffc6e675543a4913a5312be02f5c571a_name_file_960x540_1600_v4_.jpg)