
Are High-Yield ETFs Junk?
The high-yield bond market poses unique challenges to index funds that make an active approach more attractive.
/s3.amazonaws.com/arc-authors/morningstar/56fe790f-bc99-4dfe-ac84-e187d7f817af.jpg)
The high-yield bond market is not very conducive to index investing. High-yield bonds are expensive to trade and more likely to be mispriced than more heavily traded securities in less-fragmented markets.
The high-yield bond indexes underlying the largest exchange-traded funds attempt to work around the liquidity challenges of this market by sticking to the largest and most heavily traded bonds and weighting them by market capitalization. This approach pulls them toward the most heavily indebted issuers, which can increase the risk and make them less representative of their active peers than stock index funds. Additionally, the typical high-yield bond index fund doesn’t enjoy as large of a cost advantage over its actively managed peers as counterparts in many other categories. All these factors diminish the appeal of indexing high-yield bonds.
With this in mind, it’s not surprising that the two largest index funds in the high-yield Morningstar Category,
Trading Challenges Investing in illiquid markets, like high-yield bonds, is a challenge because thinly traded securities are difficult to obtain and expensive to trade. Index fund managers can face particularly high transaction costs when they mechanically trade to match index changes. This is because they often prioritize timeliness of execution over cost. When the supply of a bond in a fund's benchmark index is limited (as is often the case), those bonds' prices must move to satisfy demand from index fund managers. These costs tend to increase with turnover.
The indexes that JNK and HYG track screen their holdings for liquidity to reduce transaction costs and make it easier for index managers to obtain the requisite bonds. For example, to qualify for inclusion in the Bloomberg Barclays High Yield Very Liquid Index, which JNK follows, bonds must have at least $500 million in par value outstanding, be among an issuer’s three largest bonds, and have been issued less than five years ago. Similarly, HYG’s benchmark, the Markit iBoxx USD Liquid High Yield Index, requires holdings to have at least $400 million in par value, and the issuer must have at least $1 billion in total debt outstanding.
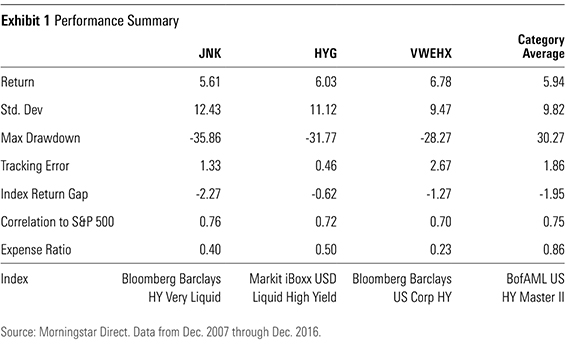
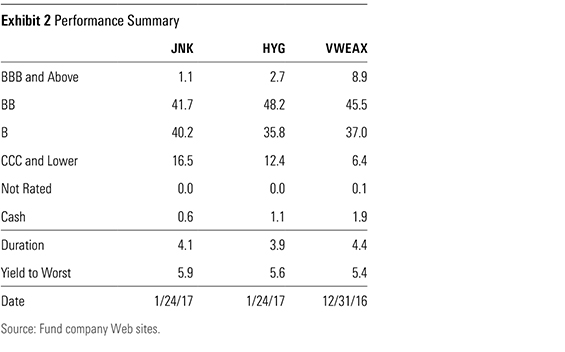
JNK Versus HYG Deciding between these two ETFs can be a difficult task because they have a lot in common. They both focus on the most-liquid segment of the high-yield bond market and weight their holdings by market cap, resulting in similar portfolios. All else equal, expenses would likely be the deciding factor in choosing between the two. This would tip the scale in favor of JNK, which charges a 0.40% expense ratio, slightly lower than HYG's 0.50% fee. But JNK has exhibited greater tracking error and turnover and has generated a slightly lower return from December 2007 (the first full-month data that are available for both funds) through December 2016 with greater risk, as shown in Exhibit 1. On top of that, it currently has greater exposure to bonds rated CCC and below, as Exhibit 2 illustrates.
Off Track? Why does it seem like JNK is missing its mark? Part of the performance gap (2.27 percentage points annualized) between JNK and its index owes to a difference between how its index is calculated and how the fund transacts in the market. The index's performance is calculated using the bid prices of the underlying bonds. These bid prices are lower than the ask prices the fund typically pays when it purchases new bonds.
This drives a persistent wedge between the fund’s performance and that of its index. This gap can be significant because bid-ask spreads in this illiquid market are often large.
HYG’s index more accurately reflects the prices available to the fund. New bonds are added to the index at the ask but are subsequently priced at the bid. This adjustment helps reduce the fund’s apparent return gap with its index but also reduces the index’s return. So it doesn’t lead to a real performance improvement, just better optics with respect to HYG’s tracking performance.
After accounting for these differences, JNK still exhibited higher tracking error than HYG from 2010 through 2015, based on data provided by State Street, but the difference was much smaller. Both funds rely on representative sampling to track their benchmarks, where they own a subset of bonds in their respective indexes with characteristics that are representative of the entire index portfolio. This approach is necessary because it is difficult and expensive to obtain many of the bonds in the index, but it increases potential tracking error. The way these funds handle investor flows into and out of their portfolios can also contribute to tracking error. When they take money in, an authorized participant delivers some of the underlying bonds and receives shares of the ETF. The bonds that the fund requests comprise what is called the "creation basket," and the bonds that it delivers out form the "redemption basket."
JNK's tracking error was greater than HYG's, partially because it had smaller creation/redemption baskets that, up until the beginning of 2016, only consisted of 40 securities, a small fraction of the total number of securities in the index. These concentrated baskets caused the complexion of the fund’s portfolio to deviate from the index's, which contributed to its tracking error. To address this issue, State Street increased the number of securities in the fund's creation/redemption baskets to between 100 and 150 in the first quarter of 2016. (The corresponding figure for HYG is 50-100 bonds.) Around that time, it also added Bradley Sullivan to the portfolio management team. Sullivan has a strong credit research background and was brought in to help improve tracking performance. These adjustments appear to have helped reduce tracking error since they’ve been implemented, but more time is needed to determine whether their efficacy will persist.
In the long term, tracking error shouldn’t have a significant directional impact on returns. So, the more important issue to focus on is JNK’s tendency to have greater exposure to the lowest-credit-quality bonds, which has made it a bit riskier than HYG. Those who can stomach this risk will likely be rewarded with slightly higher returns over the long term, although as its record attests, that is far from certain.
While these two ETFs are by far the biggest high-yield index funds available, Deutsche X-trackers USD High Yield Corporate Bond HYLB is a promising alternative. The index it tracks is nearly identical to HYG’s, but the fund charges a lower 0.25% expense ratio. This fund launched in December 2016, so it has not yet established a meaningful record.
An Active Approach By necessity, these ETFs' investment universe is limited to the most-liquid segment of the high-yield bond market. But less-liquid bonds often offer higher returns as compensation for their liquidity risk. Active managers have greater flexibility to manage this risk and earn the accompanying premium. They also have the freedom to hunt for bargains among securities that are not rated (though this is usually a small part of most active portfolios), while the indexes must stick to securities rated by S&P, Moody's, or Fitch.
Strong credit analysis can also pay off here because so many investors rely on the ratings agencies to assess issuers’ creditworthiness on their behalf. Those who can recognize improving or deteriorating credit quality ahead of the agencies stand to profit. Liquidity constraints and informational inefficiencies give skilled active managers greater opportunities to outperform in the high-yield bond market than in the stock market, but they also create greater risks for unskilled managers. Of the 156 active funds that were around at the beginning of December 2007, 90 survived and outpaced HYG (and 100 beat JNK) from that date through January 2017 [1].
Active managers in this category don’t all get a pass, and as always, costs still matter. VWEHX is among the cheapest and most compelling options in the category. Wellington’s Michael Hong has managed this fund since 2008 and is supported by an experienced team of analysts. Hong and his staff rely on fundamental credit analysis to identify attractive opportunities. They have parlayed their insights, flexibility, and sizable cost advantage into attractive risk-adjusted performance. Exhibit 1 shows the performance of this fund, along with the two ETFs and the category average.
The Vanguard fund generated slightly higher returns than the two ETFs from December 2007 through December 2016, as shown in Exhibit 1. And it did so with lower risk, as its lower volatility and maximum drawdown attest. Of course, it still took plenty of risk. Like most high-yield funds, the Vanguard portfolio had a higher correlation to the S&P 500 than to the investment-grade bond market. But it reduced risk by tilting toward high-yield bonds at the higher end of the quality spectrum. This orientation can cause the fund to lag its peers in strong credit environments and sacrifice yield. But its strong credit analysis, cost advantage, and tilt away from the lowest-credit-quality securities should help it continue to offer a better risk/reward profile than most of its peers over the long term.
Summary
- The illiquid high-yield bond market is not conducive to index investing because index funds can incur high transaction costs when thinly traded securities move into or out of the index. And index funds cannot take advantage of security mispricing, which is likely more common here than in the stock market.
- JNK has experienced greater tracking error than HYG, but this is partially because of differences in how the funds' indexes are calculated. State Street has taken steps to reduce JNK's tracking error.
- An active approach to investing in high-yield bonds is probably a better option than indexing. Among these strategies, VWEHX is one of the most compelling. It is cheaper than JNK and HYG and has low turnover. It doesn't take as much credit risk as many of its peers, but it has still generated attractive returns through credit analysis and a sizable cost advantage.
[1] This calculation is based on the oldest share class for each fund.
Disclosure: Morningstar, Inc. licenses indexes to financial institutions as the tracking indexes for investable products, such as exchange-traded funds, sponsored by the financial institution. The license fee for such use is paid by the sponsoring financial institution based mainly on the total assets of the investable product. Please click here for a list of investable products that track or have tracked a Morningstar index. Neither Morningstar, Inc. nor its investment management division markets, sells, or makes any representations regarding the advisability of investing in any investable product that tracks a Morningstar index.
/d10o6nnig0wrdw.cloudfront.net/09-25-2023/t_f3a19a3382db4855b642d8e3207aba10_name_file_960x540_1600_v4_.jpg)
/d10o6nnig0wrdw.cloudfront.net/04-09-2024/t_e87d9a06e6904d6f97765a0784117913_name_file_960x540_1600_v4_.jpg)
/cloudfront-us-east-1.images.arcpublishing.com/morningstar/T2LGZCEHBZBJJPPKHO7Y4EEKSM.png)
:quality(80)/s3.amazonaws.com/arc-authors/morningstar/56fe790f-bc99-4dfe-ac84-e187d7f817af.jpg)