
Answers to Your Target-Date Fund Questions
As assets in target-date mutual funds approach $1 trillion, we tackle common investor questions in our annual landscape report.
/s3.amazonaws.com/arc-authors/morningstar/0c1d596a-78d2-477f-acfc-a1ff33479805.jpg)
Morningstar recently released its annual report on target-date funds, which continue to gain steam as an all-in-one investment for workers who are saving for retirement. The funds' clear outlook for growth has resulted in an ever-changing landscape, as target-date managers vie for market share by attempting to set themselves apart from one another.
This year's report highlights the major trends and developments in the target-date fund space by addressing some of the questions most frequently asked by investors, investment consultants, and the like. Here's just a sampling of the 20-plus questions covered in the report. The questions below come mainly from the "Assets, Flows, and the Competitive Landscape" section of the report.
Q: How many assets are in target-date funds? And how have flows been?
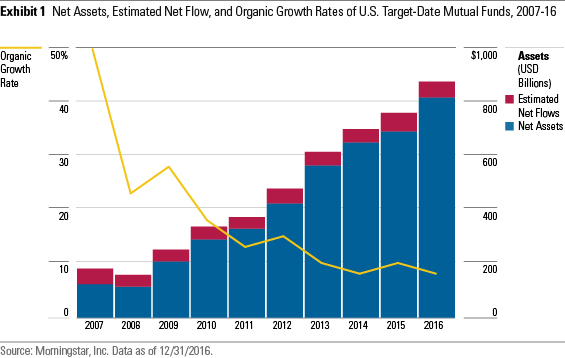
A: Target-date mutual funds saw another year of strong flows in 2016, though not quite as strong as seen in 2015. The inflows, coupled with the funds' generally positive returns, lifted assets to over $880 billion by the end of 2016.
Target-date funds' prominence continued to grow in 2016. As displayed in Exhibit 1, assets in target-date mutual funds reached an all-time high of $880 billion by the end of 2016, up from $763 billion the previous year. Assets in the funds have increased each year since 2008, when the financial crisis wreaked havoc across the board. The asset growth in 2016 came from the combination of positive returns--the average return for Morningstar's target-date fund categories ranged from 5.1% to 8.2%--and positive flows from investors.
Flows to target-date mutual funds in 2016 didn't match 2015's banner year, but they weren't far off. The funds saw an estimated $59 billion in net inflows in 2016, compared with 2015's $69 billion. The funds' common role as the default investment option in most defined-contribution plans led to the steady flows, as investors contribute to funds with each paycheck. The move to collective investment trusts from mutual funds explains, at least in part, why 2016's flows failed to keep pace with 2015's. For instance, Vantagepoint converted its Milestone mutual fund series to CITs in September 2016, and that series had more than $4 billion in assets at conversion. Also, Wells Fargo reported that a large portion of its $6 billion in outflows in 2016 was attributable to a large transfer from its mutual fund series to its CIT version.
Q: Are active or passive series of target-date funds attracting more assets?
A: Over the past couple of years, target-date series that invest exclusively in index funds have seen more flows than those that use actively managed underlying funds. As a result, the market share of active and passive series has converged.
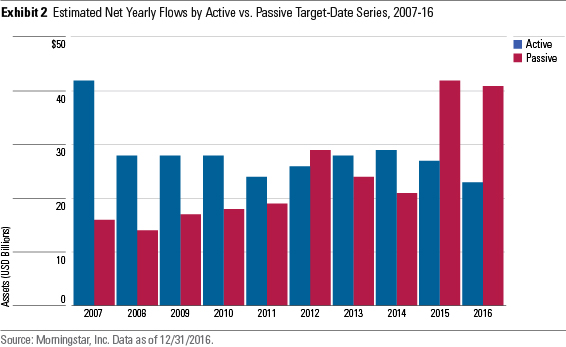
Target-date series that hold only index funds--commonly called passive series--have attracted significantly more flows than ones that invest primarily in actively managed funds in each of the past two calendar years. (As emphasized in the 2016 Target-Date Fund Landscape report, no target-date series is truly passively managed, as every target-date manager makes active decisions in building a glide path and selecting asset classes.) In 2016, passive series saw more than $40 billion in estimated inflows compared with $23 billion for active ones. This suggests that roughly two of every three dollars directed to target-date mutual funds that year went to a passive series. This built on the trend that emerged in 2015.
Passive target-date series haven't always had the edge on flows. As displayed in Exhibit 2, the positions were flipped in 2007 when active series reaped more than $40 billion in estimated inflows, whereas passive series only saw $16 billion in estimated inflows. Active series generally attracted more flows until 2012 when passive series saw slightly higher inflows. Only in the past couple of years have passive series had a sizable advantage.
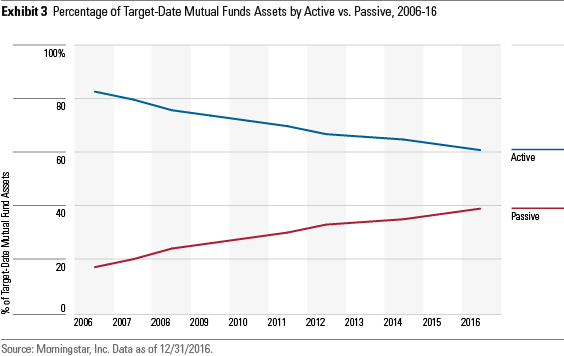
As a result of investors' increased interest in passive series, the asset split between active and passive series has converged. As shown in Exhibit 3, active series' lead in terms of assets has dwindled over the past 10 years. At the end of 2006, active series held 83% of target-date mutual fund assets, but by end of 2016 they only accounted for 61% of assets. While active series still hold the lead, passive series are poised to keep closing the gap unless the prevailing trend with flows reverses.
Q: What are firms doing to compete?
A: Firms are more commonly offering multiple approaches to fit a variety of investor preferences, and then naming them to reflect the approach.
Instead of relying on a single approach, target-date managers have become more inclined to offer variations of their legacy offering, or even completely different approaches. Initially, firms came to market with a single approach and sought to convince investors of its superiority. That changed in 2008 when Voya--then under the ING name--launched a version of its strategy that invested only in index funds. By the end of 2016, 12 firms offered more than one target-date series.
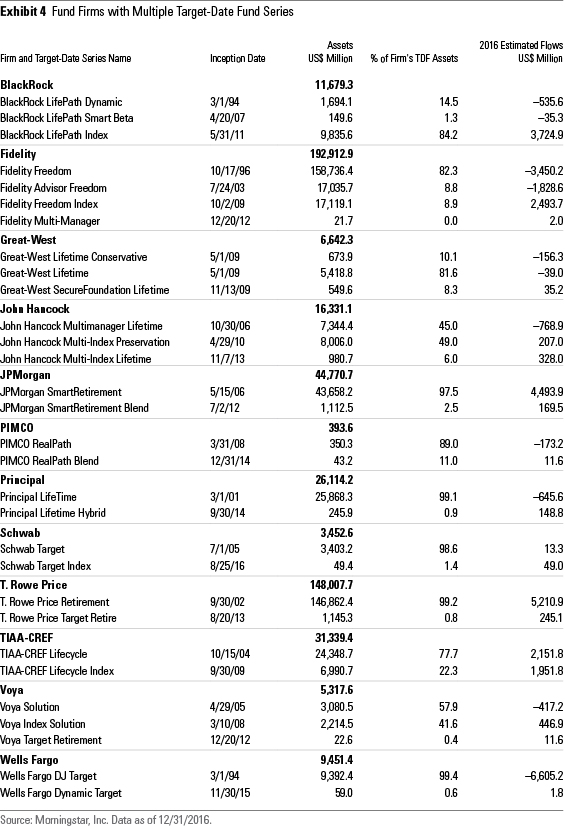
In most cases, one series still represents the lion's share of a firm's target-date assets. As displayed in Exhibit 4, 10 of the 12 firms that offer more than one series have at least 75% of their target-date fund assets in a single series. John Hancock serves as an exception, as its Multimanager Lifetime and Multi-Index Preservation series hold nearly the same amount of assets. The latter launched nearly four years after the former, but it held more assets than the legacy series at the end of 2016. Voya is the only other firm that splits at least 40% of assets between two series.
New series often fail to garner interest. Five of the firms--JPMorgan, Principal, Schwab, T. Rowe Price, and Wells Fargo--have at least 97% of their target-date fund assets in a single series. In most of these instances, the new series haven't been around long. The BlackRock LifePath Index, which launched in 2011, stands out as a series that came long after the initial offering yet now represents the majority of its firm's target-date assets. That series represented nearly 85% of BlackRock's target-date assets at the end of 2016 despite just reaching its five-year mark that year. BlackRock launched its legacy offering in 1994.
Investors appear to be gravitating toward a firm's index-based offering over the actively managed one. BlackRock offers three target-date series, but BlackRock LifePath Index was the only one that saw positive estimated flows in 2016. Fidelity Freedom, which invests predominantly in actively managed underlying funds, remained the second-largest target-date series at year-end. However, that series saw outflows in 2016, whereas Fidelity's much smaller Freedom Index series experienced positive flows. Similarly, the two John Hancock series that focus on index funds saw positive flows in 2016, whereas the legacy offering saw outflows. Voya and Schwab also saw more interest in their index-based offering than their active one, with TIAA-CREF serving as an exception.
Q: What has happened to the cost of target-date funds?
A: Fees for target-date funds continued to decline in 2016, building on a multiyear trend.
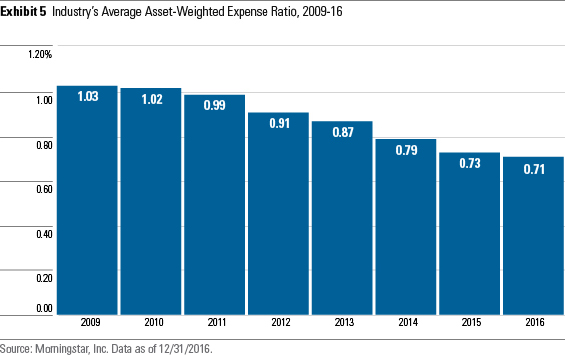
Unsurprisingly, target-date fund fees continued to tick down. Even though the U.S. Department of Labor's Fiduciary Rule remains in limbo, a flurry of lawsuits brought against plan sponsors alleging excess fees in defined-contribution retirement plans have elevated attention to fees. Concurrently, the general preference for passive investing continues to grow, thereby spurring active managers to bring down costs to stay competitive. Target-date funds--the commonly used default option in defined-contribution plans--have reaped the rewards of the downward pressure on fees. The average asset-weighted expense ratio for a target-date series was 0.71% at the end of 2016. That's only down slightly from 0.73% in 2015, but it represents a considerable decline from five years ago when the asset-weighted average expense ratio was nearly 1.00%. Exhibit 5 illustrates the steady decline in fees over the past eight years.
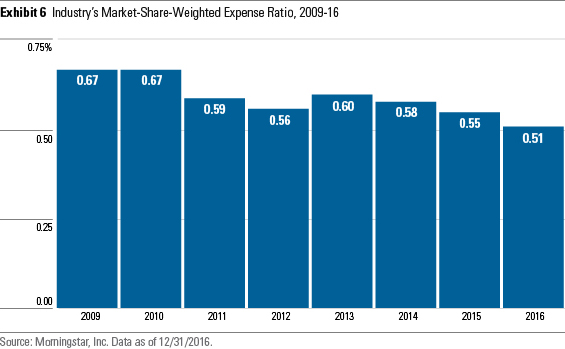
Most investors actually pay less than the average asset-weighted expense ratio since investors, or their plan sponsors, have gravitated toward lower-cost target-date series. For instance, industry behemoth Vanguard, which has a series with one of the lowest expense ratios, has over 30% of the market share for target-date mutual funds, whereas many firms have less than 1% market share. The good news for investors is that low-cost target-date series' success in attracting assets has caused peers to lower fees to stay competitive. Exhibit 6 shows the market-share-weighted expense ratio, weighing each series' asset-weighted expense ratio according to its market share.
/d10o6nnig0wrdw.cloudfront.net/04-25-2024/t_d30270f760794625a1e74b94c0d352af_name_file_960x540_1600_v4_.jpg)
/cloudfront-us-east-1.images.arcpublishing.com/morningstar/DOXM5RLEKJHX5B6OIEWSUMX6X4.png)
/cloudfront-us-east-1.images.arcpublishing.com/morningstar/ZKOY2ZAHLJVJJMCLXHIVFME56M.jpg)
:quality(80)/s3.amazonaws.com/arc-authors/morningstar/0c1d596a-78d2-477f-acfc-a1ff33479805.jpg)