
20 Years In, Have TIPS Delivered?
TIPS have performed well as insurance against inflation, but they haven’t proven themselves as an investment vehicle.
/s3.amazonaws.com/arc-authors/morningstar/fadee740-dfeb-494d-95b1-c462d0ac1f59.jpg)
Treasury Inflation-Protected Securities have been with us for 20 years now. On Jan. 29, 1997, the U.S. Treasury held its first auction for a 10-year inflation-indexed note. Later that year, a five-year inflation-indexed note was introduced, followed by a 30-year version in 1998.
The market grew fitfully. At first, investor interest was tepid, in part due to investors’ lack of understanding of the new instruments, and the novelty of comparatively low stated coupons that were below 4% (and which didn’t and don’t directly reflect inflation adjustments), during a period when conventional Treasuries were sometimes yielding close to 7% and mortgage securities even more.
Also contributing to TIPS’ slow start was the fact that the Treasury’s needs for borrowed money were unusually low at the time—it's hard to remember, but the federal government ran a budget surplus between 1998 and 2001—which meant light supply and modest liquidity. The five-year note was thus discontinued soon after its debut, only to be reintroduced in 2004. Twenty-year TIPS were introduced in 2004 and discontinued in 2009. The Treasury eventually settled on auctioning TIPS in five-, 10-, and 30-year maturities.
Those fits and starts notwithstanding, the TIPS market has since grown to its respectable current size of over $1.2 trillion, which constitutes about 9% of the overall Treasury market. Lehman Brothers, which still had more than a decade to live back then and was the premier bond-index provider, didn’t waste time and started its U.S. Treasury TIPS Index in February 1997 (Lehman’s indexes have since moved first to Barclays and more recently to Bloomberg). Mutual funds were not far behind, though it took time for investors to warm to the idea. PIMCO started its
What Worked? The main attraction of TIPS is that they are supposed to be an explicit, direct hedge against inflation as measured by the U.S. Consumer Price Index. In technical terms, TIPS promise the holder a non-negative real return. Real return is the return on your investment after adjustment for inflation, as opposed to nominal return, which uses the initial dollar amounts as the baseline. To use a simple example, if someone promises you a 3%—nominal—return on your investment in one year, but inflation was 4% over that period, your purchasing power would decline. Your real return would be negative 1%. For the past several years, returns on cash were nominally positive, barely, but negative in real terms. If you hold an actual TIPS, your horizon coincides with the maturity of the bond, and your real yield was positive at the time of purchase, that is indeed what you'll get; your real return will be positive (unless the U.S. government were to renege on its obligations, a hopefully unlikely event). Under those assumptions, at maturity you will get at least as much principal as you invested, inflation adjusted (and you can't get back less, even if inflation is negative), plus all the interim coupon payments based on a fixed percentage, of a par value that rose as long as inflation was positive.
But those assumptions don’t always hold if you’re invested in an index consisting of TIPS of various maturities and yields at purchase, or for an investor who invests in a TIPS fund. The index levels or fund’s prices are determined by the market’s pricing of individual bonds inside it, so there’s no guarantee you will be made whole on an inflation-adjusted basis.
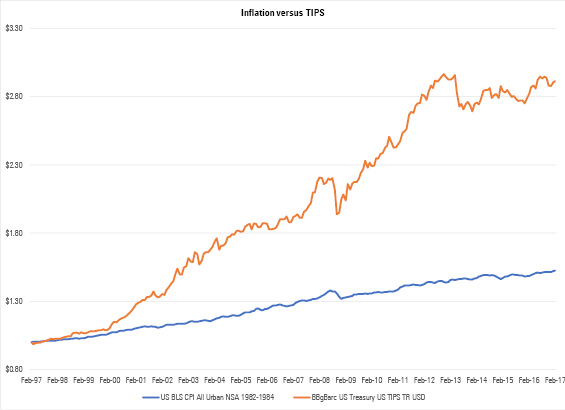
That issue is brought into sharper relief when you examine prolonged periods during which the TIPS market failed to keep up with inflation. Thus the first item on our agenda is: Did the TIPS market as a whole acquit itself of this promise to beat inflation over the past 20 years? The answer is a resounding yes. The exhibit below shows the cumulative growth of inflation and the cumulative return of the TIPS index.
- source: Morningstar
TIPS have also spawned a whole cottage industry of gauging future inflation expectations, widely followed by market players, central bankers, and academics. (In fact, generating that observable data was one argument in favor of creating the TIPS market. In earlier years it was common for many of those constituencies to assume that real yields remain fixed in their models.) In one of the basic models of nominal Treasury yields, the nominal yield includes payment to the holder of the real interest rate over a given horizon, plus the market’s inflation expectations. (The term nominal in this case can be considered interchangeable with “plain-vanilla.”)If inflation expectations are, for example, 2% for the next five years, and the real interest rate is 3%, the nominal yield should be 5%.
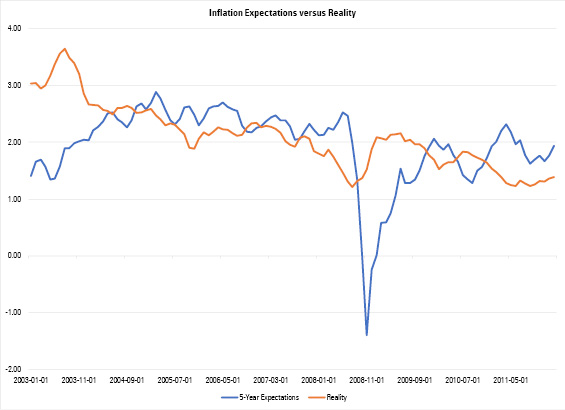
The introduction of TIPS brought with it a market-determined observable real rate of interest, which is what the yield on a TIPS is. If you subtract the TIPS yield from the comparable-maturity nominal Treasury yield, you get the market’s inflation expectation over the period until maturity of these two bonds. This is called “breakeven inflation,” because it is the level of inflation at which returns for the nominal and inflation-indexed bonds should break even. The exhibit below shows how well pricing in the TIPS market predicted subsequent inflation. What you see is the breakeven inflation rate for the following five years, compared with actual realized inflation over that period. Since it’s a five-year prediction, the horizontal axis ends five years ago, when the market was calling for inflation between 2012 and 2017 to be around 1.9% annualized.
- source: Morningstar
Overall, the results don’t look bad, even though they have certainly not been precise and have had some notable misses. In particular, the markets seriously underestimated subsequent inflation during the financial crisis. In part, that had to do with the fact that TIPS—like nearly every other bond that wasn’t a conventional Treasury—were badly hurt when liquidity evaporated toward the end of 2008. Still, the low inflation “call” the markets made in 2008 and 2009 stands in stark contrast to numerous commentators who were hyperventilating over hyperinflation. And in fact, inflation has remained stubbornly low in subsequent years, below its historical averages of the past several decades, and despite the Fed’s efforts to lift it. The markets weren’t right at that point, but they were less wrong than many in the years since.
What Didn't Work So Well? In this section we want to document the fact that, for all their merits, TIPS haven't always lived up to expectations. The virtues of TIPS, we are often told, are twofold: They are an inflation hedge, and they are lowly correlated with other assets. Let's examine these by turn.
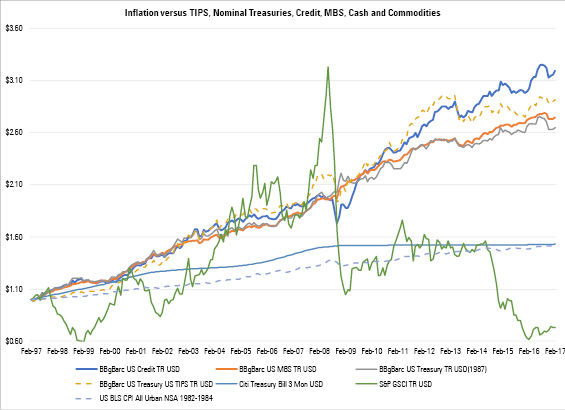
We documented in Exhibit 2 the fact that over the past 20 years TIPS did, in fact, beat inflation handily. But how much better were they in this respect than other fixed-income assets? Not that much, it turns out. Exhibit 3 below shows how other investment-grade fixed-income assets fared against inflation. (The inflation and TIPS lines are dashed for better visibility.)
- source: Morningstar
Here, TIPS still look good, but not exactly outstanding. The past two decades were generally favorable for fixed-income investors, as inflation has been subdued and rates have generally trended down, so all fixed-income assets performed well. In the horse race among investment-grade assets, U.S. credit did best, followed by TIPS, mortgages, and nominal Treasuries, but all did respectably well and all beat inflation by a wide margin. Cash has basically kept up with inflation. In the exhibit we also include commodities, which are sometimes hawked as a hedge against inflation; as we can see, they failed to deliver on that count in a spectacular fashion. (In fairness, the S&P Goldman Sachs Commodity Index we are using is dominated by energy exposure, which has been extraordinarily volatile over the past two decades).
Correlation with inflation is another angle from which one can evaluate TIPS claim to be an inflation hedge. The concept of a “hedge” is somewhat fuzzy in a lot of financial reporting, though. To bring some definitional clarity to the issue, something is an effective hedge if it is highly correlated, whether positively or negatively, with whatever it is supposed to hedge.
The correlation of monthly returns of the TIPS index against monthly changes in inflation stands at 0.09. This is a very unconvincing number for an effective hedge. If you buy TIPS at a positive real interest rate and hold them for a long period, you will be protected against inflation; we saw that in Exhibit 3. But that doesn’t make it, technically, a hedge for shorter periods of time. In fact, the longest time period over which TIPS underperformed inflation was 63 months. This means there was a five-year period over which the TIPS index (in terms of total return) trailed inflation. Five years is a long time to trail what you are supposed to hedge.
Low correlations with other assets are brought up as another advantage of TIPS. Exhibit 4 shows the correlation of TIPS with other fixed-income indexes, as well as stocks (domestic and foreign); we add cash and commodities to complete the picture.
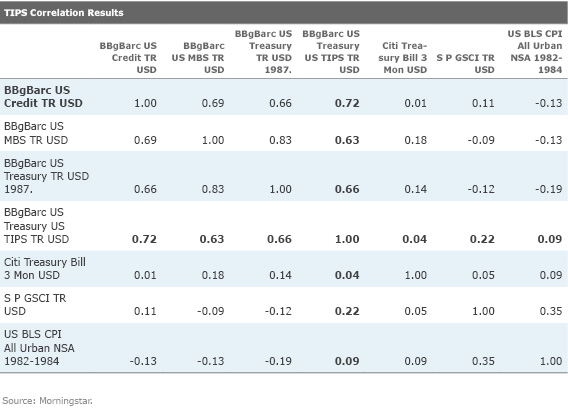
TIPS’ correlation with other fixed-income assets was actually on the high side, though, and while the correlation with equities is low, Treasuries and mortgages correlations with equities were even lower (negative, in fact). There is nothing remarkable about TIPS here. This analysis is confirmed by the fact that if one feeds the return series of these assets to an optimizer to create an efficient frontier, TIPS don’t make it to any of the efficient frontier portfolios. TIPS are not part of the efficient frontier. (For those who need an Investments 101 refresher, an efficient frontier is the set of the most optimal portfolios, meaning the set of portfolios that give the highest return for a given level of risk. It thus takes into account not just risk and return, but correlations of each asset class with all the other asset classes.)
Finally, it deserves mention that TIPS sometimes behave as if they were risk assets, and sometimes as if they were nominal Treasuries on steroids. We’ve seen two major episodes that illustrate the point well: The 2008-09 financial crisis, and the Taper Tantrum of 2013. When U.S. equities plummeted by more than 25% and market liquidity evaporated in September and October 2008, TIPS dropped by 12%—even as nominal Treasuries eked out a small gain. In fact, TIPS lost almost exactly the same amount as investment-grade corporates over that period.
To this day it is not exactly clear why this happened. The most plausible hypothesis combines lower inflation expectations, due to recession, and the markets’ insatiable appetite for liquidity. Even though TIPS are technically as safe as nominal Treasuries from a credit perspective, the TIPS market is not anywhere near as liquid, and TIPS are less likely to be used as collateral in intra-bank transactions. So, the thinking goes, banks and other market participants dumped TIPS to get their hands on nominal Treasuries. Conversely, during the frantic rally of risk assets in 2009, TIPS gained over 11%, even as nominal Treasuries lost more than 3%. This was the TIPS-as-risk-assets episode.
By contrast, a notable TIPS-as-nominal-Treasuries-on-steroids episode occurred in May and June 2013, the Taper Tantrum months. After then-Fed-Chair Ben Bernanke intimated that rates might have to go up, TIPS lost almost 8%, compared with nominal Treasuries’ loss of less than 3%. TIPS’ sensitivity to changes in nominal yields has historically been a subject of debate, but on that occasion TIPS behaved as if their nominal-rates duration was far, far longer than that of nominal Treasuries’. That is clearly frustratingly unpredictable behavior.
Just Another Asset Class The picture that emerges from these 20 years of TIPS history is nuanced. On the one hand, TIPS did beat inflation over the long run. On the other hand, so did many other fixed-income assets, and TIPS' correlation with inflation is very low. On the one hand, correlations between TIPS and equities was low. On the other hand, Treasuries and mortgages showed an outright negative correlation with equities. TIPS have performed well, but their correlation and volatility patterns didn't make it part of an efficient portfolio, based on the past 20 years of history. What are we left with? Just another asset class. This history shows that there is nothing inherent in the TIPS structure that makes them attractive or unattractive. The best that can be said is that they provide explicit insurance against inflation, and may thus be attractive to those investors who are really buying insurance rather than investing. Given those investors' demand for certainty, they should more properly be called savers.
As with any asset class, investors must evaluate TIPS' merits in view of current conditions and future expectations—in a word, valuations—and only then decide if they are right for their portfolios. In other words, they ought to be treated as any other asset class. As for valuations, a cautionary reminder: Old-style economic theory posits that an economic system is in equilibrium if its real interest rate equals the real rate of economic growth. We have not seen this for years now. 10-year TIPS yields—the real interest rate—have stubbornly stayed below 1% since 2011 even as annual economic growth has consistently stayed above 1%. As of this writing, the yield on the 10-year TIPS was 0.6%. Maybe TIPS are right. Maybe the economic theory is wrong. Maybe the system is not in a good equilibrium. But if real yields were to rise to match the level of economic growth, TIPS prices would have to be lower, which makes it hard to see them as a screaming buy.
/cloudfront-us-east-1.images.arcpublishing.com/morningstar/HDPMMDGUA5CUHI254MRUHYEFWU.png)
/cloudfront-us-east-1.images.arcpublishing.com/morningstar/OMVK3XQEVFDRHGPHSQPIBDENQE.jpg)
:quality(80)/s3.amazonaws.com/arc-authors/morningstar/fadee740-dfeb-494d-95b1-c462d0ac1f59.jpg)