
Digging Deeper When Measuring Diversification
Even concentrated funds can be diversified.
/s3.amazonaws.com/arc-authors/morningstar/64dafa24-41b3-4a5e-aade-5d471358063f.jpg)
A version of this article appeared in the February 2017 issue of Morningstar ETFInvestor.
An index fund that follows a well-constructed benchmark and levies a low fee is usually a winning proposition. Market-cap-weighted indexes are particularly attractive, given that they outsource the work of price discovery to active market participants and tend to have low turnover. Market-cap weighting typically works best in those cases where an index is broadly diversified--as in the case of a total U.S. stock market index, for example. But market-cap weighting a smaller investment opportunity set, such as a sector, can create a concentrated portfolio and thus may introduce a greater level of stock-specific risk. So how should investors evaluate a concentrated fund's level of diversification, or lack thereof?
Here, I take a look at a variety of metrics that one might use to measure diversification. I apply them to a sample of equity sector ETFs. These funds' underlying indexes market-cap-weight narrow investment opportunity sets (U.S. equity sectors). State Street Global Advisors and Vanguard offer sector ETFs with track records spanning at least 10 years. Vanguard offers an ETF covering each of the 11 Global Industry Classification Standards sectors. SSgA offers just 10 sector ETFs, as it combines the information technology and telecom sectors into one fund:
Common metrics investors might use as a proxy for a fund's degree of diversification include 1) its average number of holdings and 2) the percentage of the fund's assets invested in its top 10 holdings. But these are blunt instruments. To address their shortcomings, I also assess these funds' level of diversification by looking at the average pairwise correlations of their top 10 holdings. All of the data I used was sourced from Morningstar Direct and is through the end of December 2016.
The More the Merrier? Many investors are familiar with the rule of thumb that an equity portfolio is well-diversified if it holds at least 30 stocks because single-stock risk can be diversified away when stocks are combined. This concept can be traced back to a paper[1] published by Lawrence Fisher and James Lorie in 1970, which concluded that a 32-stock portfolio's returns are 95% less volatile than those of a single stock. So, if a fund holds more stocks, then it should be better diversified and less risky, right?. Not so fast. Simply counting the number of holdings in a portfolio does not consider the weighting of each security, and market-cap-weighted funds, by definition, do not hold positions in equal weightings. Like most rules of thumb, the number of holdings in a fund provides a starting point to measure diversification, but we need to dig deeper.
The percentage of a fund's assets represented by its top 10 holdings is another lens through which to view its level of diversification. Unlike a fund's holdings count, this measure incorporates stock weightings. The largest stocks tend to dominate market-cap-weighted funds that track narrow opportunity sets. By this metric, if a fund's top 10 holdings represent a smaller percentage of its portfolio, then it should be--in theory--better diversified than those funds whose 10 largest holdings soak up the bulk of their assets. However, this measure also has shortcomings. Specifically, it doesn't consider whether the prices of a fund's top 10 holdings tend to move with one another.
Be Different Analyzing stocks' correlations with each other provides a clearer sense of the true level of diversification in an equity portfolio. To assess the interaction between the holdings of the funds in my sample, I measured the pairwise correlations of the monthly returns of each fund's top 10 holdings during the 10-year period ended December 2016. I then took the average of these values to gauge each fund's degree of diversification. A fund should be better diversified if its holdings are less correlated. Conversely, a higher level of correlation amongst the stocks in a portfolio implies a lesser degree of diversification--irrespective of how many stocks the fund holds or how large a portion of its portfolio is allocated to its 10 largest holdings. Exhibit 1 shows the average number of holdings, the percentage of portfolio represented by the top 10 holdings, and the average of the pairwise correlations for the top 10 holdings for each of the 20 equity sector funds I examined through the end of 2016.
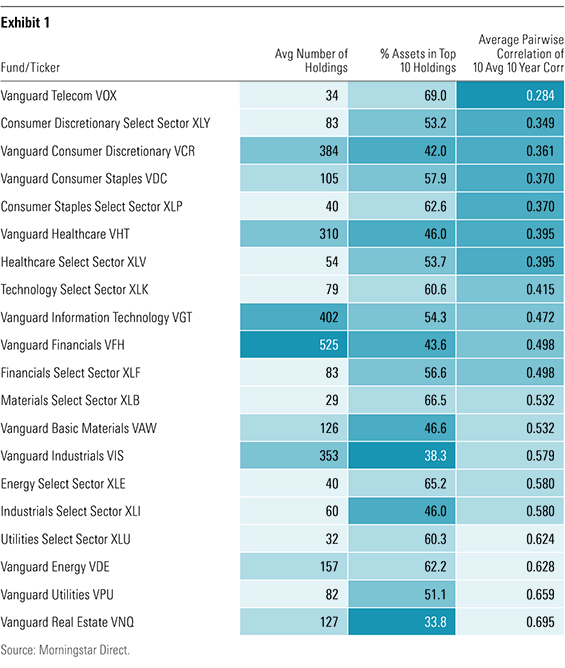
I have sorted the funds in ascending order by the correlation figure. Intuitively, those fund's whose top 10 holdings face similar risk factors should have higher correlation figures and thus provide a lesser degree of diversification. Vanguard Telecommunication Services ETF VOX had the third-fewest average number of holdings and highest percentage of its fund represented by its top 10 holdings. As sized by more rudimentary measures of diversification, this fund doesn't stack up well. But exploring how its top 10 holdings interact with each other paints a different picture. VOX's top 10 holdings had the lowest average pairwise correlations (28.4%) among the 20 sector funds in the sample. Conversely,
In Exhibit 1, we see that real estate, utilities, energy, industrials, and basic materials sector funds' all had correlation figures above 0.50. This makes economic sense as firms that operate in these sectors tend to share similar fundamentals. For example, fluctuating oil prices affect most energy stocks and interest-rate changes affect nearly all real estate stocks. On the other hand, telecom, consumer discretionary, consumer staples, healthcare, and information technology sector funds' correlation figures were all below 0.50. Again, this owes to fundamentals. These sectors' largest stocks are less correlated to the extent that they have more diverse business lines facing a more varied set of risk factors.
Let's take a closer look at
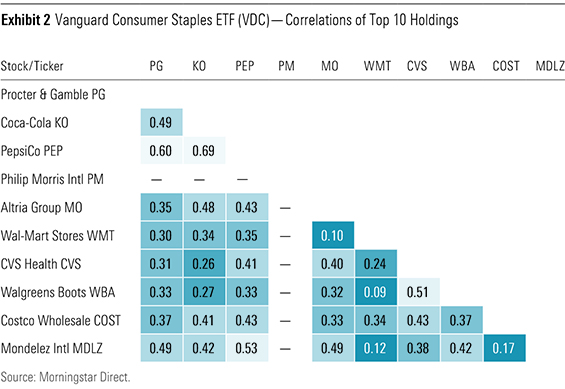
Data for
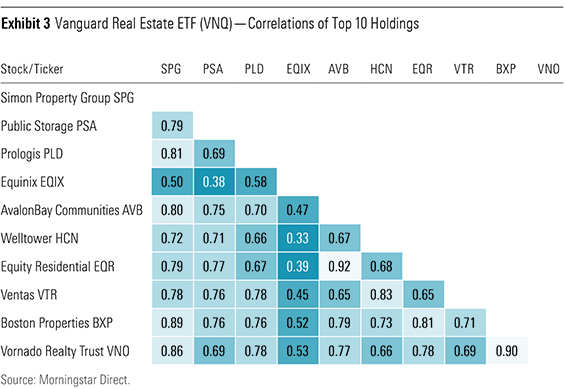
On the flip side, VNQ's top 10 holdings represent about 35% of its portfolio, but these stocks have tended to move in the same direction more often than not. The real estate sector is not well-diversified. There is only one GICS industry in the sector, and you guessed it, it's the real estate industry. Exhibit 3 shows the pairwise correlations amongst VNQ's top 10 holdings.
Takeaway? Dig Deeper In 1952, Harry Markowitz introduced the efficient portfolio frontier, which laid the groundwork for Modern Portfolio Theory. One of his key insights was that an investor can reduce risk by holding a combination of assets that are not perfectly correlated. Investors eyeing concentrated market-cap-weighted funds should apply this framework at the fund level. Because market-cap weighting a small investment opportunity set can create concentrated portfolios, understanding how the fund's top holdings interact with one another can shed more light on a fund's true level of diversification.
[1] Fisher, L., & Lorie, J. 1970. "Some Studies of Variability of Returns on Investments in Common Stocks." Journal of Business, Vol. 43, No. 2, P. 99.

Disclosure: Morningstar, Inc. licenses indexes to financial institutions as the tracking indexes for investable products, such as exchange-traded funds, sponsored by the financial institution. The license fee for such use is paid by the sponsoring financial institution based mainly on the total assets of the investable product. Please click here for a list of investable products that track or have tracked a Morningstar index. Neither Morningstar, Inc. nor its investment management division markets, sells, or makes any representations regarding the advisability of investing in any investable product that tracks a Morningstar index.
/cloudfront-us-east-1.images.arcpublishing.com/morningstar/T2LGZCEHBZBJJPPKHO7Y4EEKSM.png)
/d10o6nnig0wrdw.cloudfront.net/04-18-2024/t_34ccafe52c7c46979f1073e515ef92d4_name_file_960x540_1600_v4_.jpg)
/d10o6nnig0wrdw.cloudfront.net/04-09-2024/t_e87d9a06e6904d6f97765a0784117913_name_file_960x540_1600_v4_.jpg)
:quality(80)/s3.amazonaws.com/arc-authors/morningstar/64dafa24-41b3-4a5e-aade-5d471358063f.jpg)