
Credit Market Insights: Bond Indexes Perform Well as Spreads Tighten Further
Both the investment-grade and high-yield indexes are trading much tighter than their long-term historical averages.
/s3.amazonaws.com/arc-authors/morningstar/54f9f69f-0232-435e-9557-5edc4b17c660.jpg)
- Rising federal-funds rate did not preclude fixed-income indexes from rising in the first quarter.
- Corporate credit spreads remain near the tightest quartile they have registered over the long term.
- The market continues to expect a couple more rate hikes this year.
Fixed-income indexes performed well during the first quarter of 2017, as interest rates held relatively steady and credit spreads tightened slightly. Corporate credit markets have been supported by a combination of generally improving credit metrics and the market's expectation that possible revisions to tax and regulatory policies enacted by the Trump administration will reinvigorate economic growth and earnings.
Morningstar's Core Bond Index, our broadest measure of the fixed-income universe, rose 0.90% in the first quarter through March 27. The return has been generated by a combination of the yield carry on the underlying securities, as interest rates have generally been flat thus far this year, and by a slight tightening in corporate credit spreads. Representative of the Treasury market, the Morningstar U.S. Government Bond index rose by 0.82% and the Morningstar Agency Bond Index rose 0.71%. Inflation expectations have also held relatively steady, and the Morningstar Treasury Inflation-Protected Securities Index has risen 1.40%.
In the corporate bond market, the Morningstar Corporate Bond Index (our proxy for the investment-grade bond market) rose by 1.41%, and in the high-yield market, the Bank of America Merrill Lynch High Yield Master Index rose 1.67%. However, while corporate bonds performed well in the U.S., the Morningstar Euro Corporate Bond Index declined 0.33%. Corporate credit spreads were relatively unchanged this past quarter, and U.S. long-term interest rates were generally steady, but in the eurozone, underlying sovereign interest rates rose as the European Central Bank began to intimate that it is nearing the time it will begin to wind down its easy monetary policy. For example, the yield on Germany's 10-year bond almost doubled, rising 18 basis points to 0.39%.
The emerging-markets fixed-income indexes posted the strongest returns in the first quarter among the fixed-income universe, as the Morningstar Emerging Market Composite Index rose 3.49%. Underlying the composite index, the Morningstar Emerging Market Sovereign Index rose 4.18%, and the Morningstar Emerging Market Corporate Index rose 3.09%.
Exhibit 1: Fixed-Income Index Returns
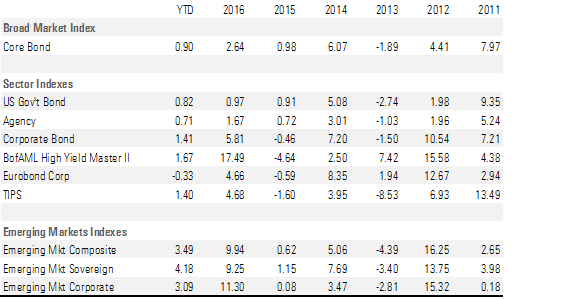
Source: Morningstar, Inc., Bank of America Merrill Lynch Global Indexes. Data as of 03/27/2017.
While the corporate bond market has been pricing in the expectation that revisions to tax and regulatory policies that might be enacted by the Trump administration will reinvigorate economic growth, recent economic activity appears to have slowed in the first quarter. Robert Johnson, Morningstar, Inc.'s director of economic analysis, is expecting that GDP growth in the first quarter will only be about 1.0%. He expects economic growth will rebound in the second quarter to 2.1% and will range between 1.75% to 2.0% for full-year 2017.
While his first-quarter estimate is below the average expectations of Wall Street economists, it is in line with the GDPNow estimate produced by the Federal Reserve Bank of Atlanta. Data over the past few weeks has led the Atlanta Federal Reserve to lower its GDPNow estimate for economic growth in the first quarter of 2017 to 1.0% from as high as 2.5% as recently as Feb. 27. Factors that have led to the lower estimate include weakening construction spending, light vehicle sales, and manufacturing reports. However, even at this slower pace, our corporate credit analysts expect economic growth should be enough to generally support the credit quality of corporate issuers and financial institutions.
Among Johnson's other forecasts, he expects that at the end of this year, the yield on the 10-year U.S. Treasury will be 3.00% to 3.50% and that the run rate of inflation will be 2.00% on a fourth-quarter over fourth-quarter basis.
Exhibit 2: GDPNow - Federal Reserve Bank of Atlanta
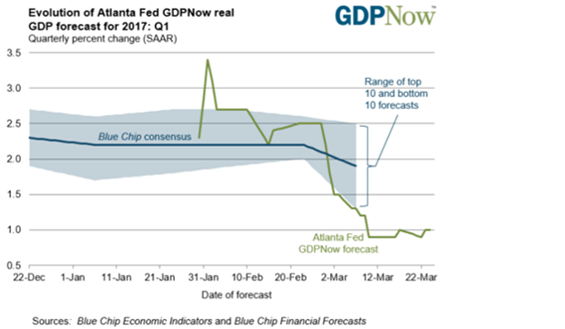
Source: Federal Reserve Bank of Atlanta.
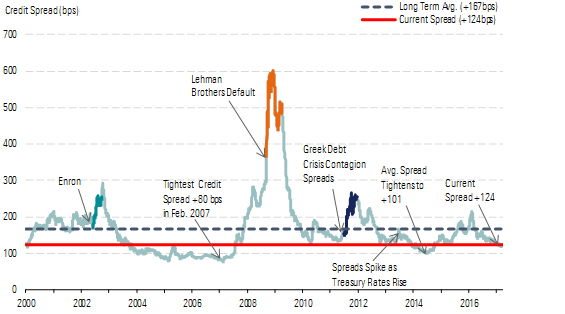
Corporate Credit Spreads Have Tightened Modestly in the First Quarter Since the end of last year, the Morningstar Corporate Bond Index, our proxy for the investment-grade bond market, tightened 4 basis points to +124, whereas the Bank of America Merrill Lynch High Yield Master Index tightened 9 basis points to +412.
Much of the tightening has occurred in sectors that are either highly correlated to improving economic conditions or to higher interest rates. For example, in the first quarter, the basic industries sector has tightened the most, as underlying commodity prices have risen off of the early 2016 lows and have held steady thus far this year. Manufacturing has also been one of the better-performing sectors this year. The rise in oil prices has improved the outlook for companies that manufacture equipment used in the oil sector, and the expectation of protectionist policies from the Trump administration has lifted companies that have significant U.S. manufacturing operations. The expectation of rising interest rates has led to outperformance by the finance sector because banks are expected to be able to raise their net interest income margins.
Exhibit 3: Corporate Bond Credit Spreads
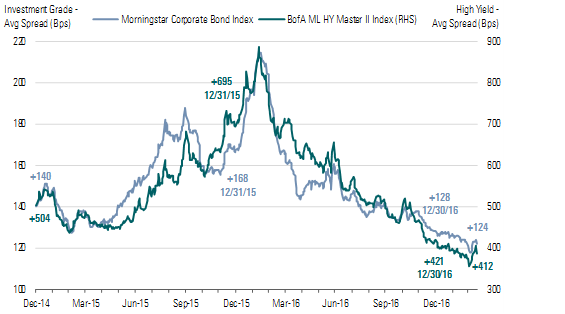
Source: Morningstar, Inc., Bank of America Merrill Lynch Global Indexes. Data as of 03/27/2017.
The retail and telecommunications sectors have performed poorly. In the retail sector, lower same-store sales and a shift away from traditional retailers to e-commerce have led to declining credit quality. In the telecommunications sector, the decline in credit quality has mainly been self-inflicted, as management teams look to increase growth through strategic acquisitions, which have been funded by greater amounts of debt, leading to worsening credit quality.
Exhibit 4: Morningstar Corporate Credit Index YTD Spread Change
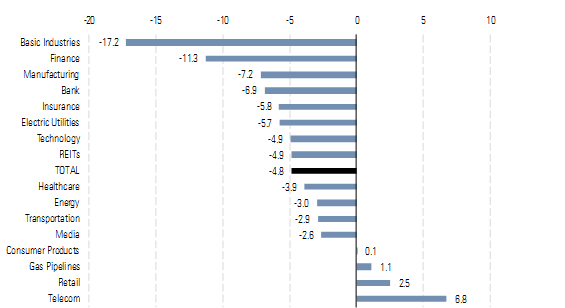
Source: Morningstar, Inc. Data as of 03/27/2017.
At current levels, both the investment-grade and high-yield indexes are trading much tighter than their long-term historical averages. Since the end of 1998, the average spread of our investment-grade index is +168, and since the end of 1996, the average spread of the high-yield index has averaged +580. As an indication of how tight corporate credit spreads have become compared with their historical averages, since the beginning of 2000, the average spread of the Morningstar Corporate Bond Index has registered below the current level only 26% of the time. In addition, not only are credit spreads tighter now than in much of the recent past, the average credit quality of the Morningstar Corporate Bond Index is lower than it has been much of the time. Currently, the average credit quality of the Morningstar Corporate Bond Index is A-, whereas since 2000, the average credit quality has been either closer to, or a single A for much of the time.
Exhibit 5: Morningstar Corporate Bond Index Average Credit Spread
Source: Morningstar, Inc. Data as of 03/27/2017.
Exhibit 6: Morningstar Corporate Credit Index Average Rating
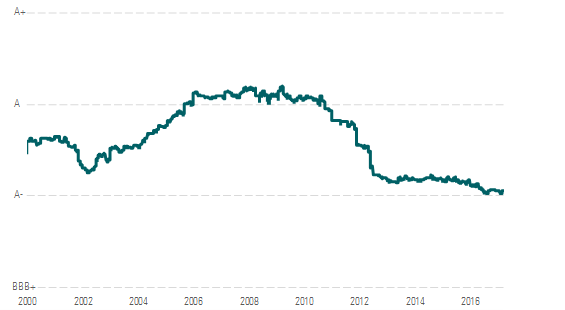
Source: Morningstar, Inc. Data as of 03/27/2017.
In the high-yield market, the average spread of the Bank of America Merrill Lynch High Yield Master Index has registered below its current level less than 25% of the time over the past 17 years. Most of the time that these corporate bond market indexes were tighter than the current credit spread was during the buildup to the 2008-09 credit crisis. In 2004 through 2007, corporate credit spreads were pushed to new historically tight levels as new structured investment vehicles were engineered to arbitrage the differentials in expected default risk; however, once the credit crisis emerged, investors found that many of these vehicles did not perform as advertised.
Exhibit 7: Bank of America Merrill Lynch U.S. High Yield Option-Adjusted Spread
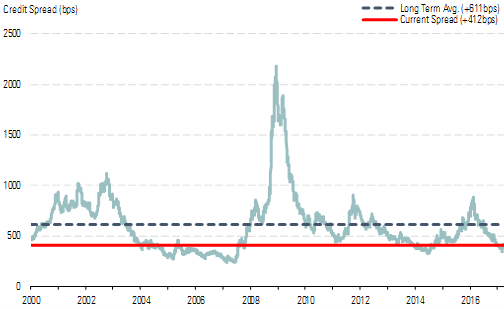
Source: Bank of America Merrill Lynch Global Indexes. Data as of 03/27/2017.
Futures Market Pricing in Additional Fed Rate Hikes The Federal Reserve raised the federal-funds rate in March by 25 basis points to a range of 0.75% to 1.00%. At the beginning of the year, the market-implied probability of a rate hike so early in the year was very low, but that rose quickly a few weeks before the March meeting of the Federal Open Market Committee, as Federal Reserve officials intimated within several public speeches that a rate hike was in the offing. However, even after this rate hike, the market continues to expect a couple more this year. The Fed's median forecast for the federal-funds rate at the end of 2017 is 1.4%.
According to data from the CME, the market-implied probability priced into the federal-funds futures market that the Fed will hike the federal-funds rate after the June meeting is 53%. The probability that it will be over 100 basis points after the December meeting is 89%. Additionally, the market-implied probability that there will be two more rate hikes this year is 55%. If the Fed were to hike interest rates two more times this year, the federal-funds rate would range between 1.25% and 1.50% at the end of this year. That would be the first time since 2008 that the federal-funds rate has risen above 1% and will finally bring it back above its previous historical low, which was reached in 2003, when the U.S. was recovering from the tech bubble.
While the Fed is tightening monetary policy in the U.S., the ECB has held its course and remains in an easy monetary policy stance. Earlier in March, the ECB decided to keep its short-term interest rates at negative yields and will maintain its EUR 60 billion monthly purchase program through year-end. However, ECB President Mario Draghi recently alluded to signs of strengthening in the eurozone and the re-emergence of inflation. Many investors took this to mean that the ECB is edging closer to dialing back its dovish monetary policy.
Exhibit 8: Federal-Funds Rate vs. 10-Year Treasury Yield
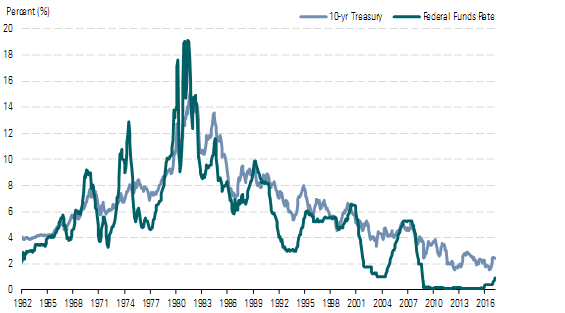
Source: Federal Reserve Bank of St. Louis. Data as of 03/27/2017.
The reason the Fed is raising the federal-funds rate is that many of the measures it watches have normalized and are either at or near their targeted levels. Unemployment is at its lowest level since 2007, and both inflation and inflation expectations have rebounded and stabilized near the Fed's 2% inflation target. For example, since oil bottomed out in February 2016, both the Consumer Price Index and the personal consumption expenditure price index (the Fed's preferred measure of inflation) have steadily risen toward, or above, the Federal Reserve's 2% inflation target.
Exhibit 9: U.S. Consumer Price Index vs. Personal Consumption Expenditure Price Index
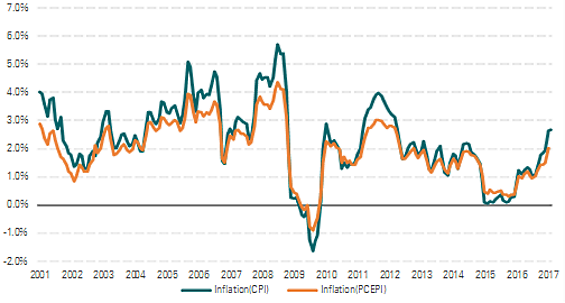
Source: Federal Reserve Bank of St. Louis. Data as of 03/27/2017.
In addition, the 5-year, 5-year forward inflation expectation rate rose above 2% in November and has held relatively steady since then.
Exhibit 10: 5-year, 5-year Forward Inflation Expectation Rate
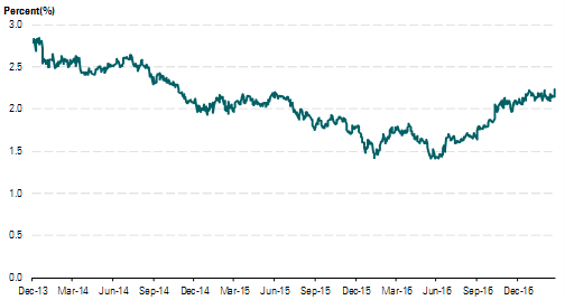
Source: Federal Reserve Bank of St. Louis. Data as of 03/27/2017.
More Quarter-End Insights
Market Outlook: Lofty Valuations Call for Careful Stock-Picking
Video Report: Few Values Left in the Global Stock Market
Economic Outlook: First-Quarter Underscores Slow Growth Expectations
Basic Materials: The Most Expensive Sector We Cover
Consumer Cyclical: Still Opportunity in a High-Confidence Environment
Consumer Defensive: Still Thirsty for Growth
Energy: Coming Shale Growth a Major Threat to Oil Prices
Financial Services: Weighing the Strategic Tradeoffs of the Fiduciary Rule
Healthcare: Stock-Picking Increasingly Important as Valuations Rise
Industrials: Solid Fundamentals, but Few Screaming Buys
REITs: Playing Defense in an Uncertain Market
Tech: Overvalued Overall, but Opportunities Remain
Telecom: Firms Strive to Be More Than 'Dumb Pipes'
Utilities: Is There Enough Growth to Offset Higher Interest Rates?
/cloudfront-us-east-1.images.arcpublishing.com/morningstar/G3DCA6SF2FAR5PKHPEXOIB6CWQ.jpg)
/cloudfront-us-east-1.images.arcpublishing.com/morningstar/6ZMXY4RCRNEADPDWYQVTTWALWM.jpg)
:quality(80)/s3.amazonaws.com/arc-authors/morningstar/54f9f69f-0232-435e-9557-5edc4b17c660.jpg)