
Active Bond Funds Holding Their Own
The latest update to the Morningstar active/passive barometer reveals that actively managed bond funds are much more likely to beat their benchmarks than equity funds.
/s3.amazonaws.com/arc-authors/morningstar/fadee740-dfeb-494d-95b1-c462d0ac1f59.jpg)
Every six months or so, Morningstar publishes its Active/Passive Barometer. The Barometer measures, by Morningstar Category, the success rate of actively managed open-end mutual funds versus their passive peers. That success is defined as both surviving and outperforming the average of the passive cohort of the category.
Exchange-traded funds have grown to be an important part of the equation, so we wanted to run a study to complement the Barometer's results by looking at active funds versus passive ETFs as well. We've used a modified version of the success metric. Rather than using a simple average of passive ETFs as the benchmark, we have constructed a replicating portfolio of ETFs for each active fund and used that portfolio as the fund's own benchmark.
The advantage of this method is that it's more sensitive to some managers' systematic deviations from the benchmark assigned to each category. (The disadvantage is that we don't capture funds that ceased to exist during that time span. We can't do this kind of analysis for funds that don't have a full returns history.)
For example, many intermediate-term bond fund managers have a strategic overweighting in investment-grade credit relative to the Bloomberg Barclays U.S. Aggregate Bond Index, the most widely used proxy for that category. Many add emerging markets and high yield as well, which are not in the index at all. Using a benchmark that captures those out-of-index risk exposures addresses that issue and creates a tougher benchmark to beat.
Finally, because of our setup, which creates an appropriate benchmark for each fund, we didn't need to split funds by category. Instead we divided them into two large groups: U.S. open-end stock funds and U.S. taxable-bond funds. Part of our goal was to discover how active managers fared against their ETF-constructed benchmarks. The other aim was to see how good a substitute ETFs are for approximating what investors can get from holding mutual funds.
What we found was that active fixed-income managers acquitted themselves well, while active equity managers performed poorly. This has obvious implications about the benefit of using active management versus using ETF investments in the stock and bond universes.
Using Returns-Based Style Analysis to Engineer a Better Benchmark The core of our approach involves constructing a portfolio made up of ETFs that replicates, to the extent possible, each fund in question. We did that with returns-based style analysis, or RBSA, an approach invented by one of the pioneers of Modern Portfolio Theory, Nobel Prize winner William Sharpe. Sharpe asked a simple question: Assuming you don't quite know what is inside a given fund, but you do know its returns, can you construct a portfolio out of things whose content you do know (for example, indexes or index funds) that would behave very much like the fund you are interested in?
The mathematical details of the process are messy (We used a quant tool called a quadratic optimizer to handle them), but suffice it to say that for most funds you can create replicating portfolios that behave very much like the funds themselves. Sharpe invented his approach to get a handle on what the real drivers of a fund's performance were. (Incidentally, Ibbotson Associates, which Morningstar acquired in 2006, popularized this approach and made it available to wider audiences through its software.) The method we used is not perfect, because it assumes constant weightings throughout the period under consideration. It is also an after-the-fact approach: By definition, a replicating portfolio approximates what a fund held during a given period in the past, so you can't assemble one in advance. Nonetheless, it gives a fair indication of what exposures or risk factors drove each fund's performance in a given time frame.
With that in mind, the question we asked--and this question was also part of the motivation for Sharpe's RBSA work--was this: If you construct a replicating portfolio for each actively managed equity fund using all available equity ETFs, would that replicating portfolio have done better than the fund itself (and the same for bond funds)? Clearly, if you could have done as well or better with a mix of passive ETFs, active funds have a problem.
Before we go on to the results, we need to be very clear about the data set we've used. We filtered our fund lists as follows. On the equity side, we used all active funds with five-year histories from the nine U.S. "style box" categories (large-growth, large-blend, and so on), excluding funds-of-funds and lifestyle funds (funds that manage asset allocations for investors with specific risk/return goals, for example). The funds had to have at least five years of continuous weekly returns for the period ended Feb. 26, 2017. For bond funds we used all active funds with the same performance record and that span pretty much all taxable-bond categories (except money market funds). For each one of both equity and bond funds, we used the cheapest share class to avoid counting the same fund multiple times. Altogether, this gave us 1,699 equity funds and 791 bond funds. For ETFs, we used only passive funds with five years of returns and excluded so-called strategic-beta offerings. We ended up with 56 equity and 84 bond ETFs to use in building the replicating portfolios.
Results First off, the replicating portfolios wound up fitting well with their active counterparts. An R-squared of 0 basically means no fit at all; an R-squared of 1 indicates a perfect fit. In our analysis, the median R-squared was 0.94 and 0.93 for stock and bond funds, respectively. This means that one can very well approximate the behavior of both equity and bond funds using ETFs.
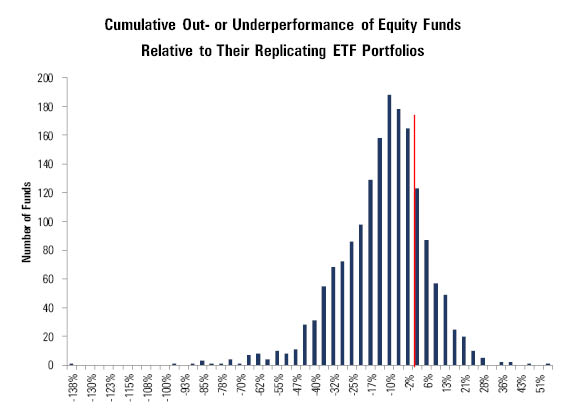
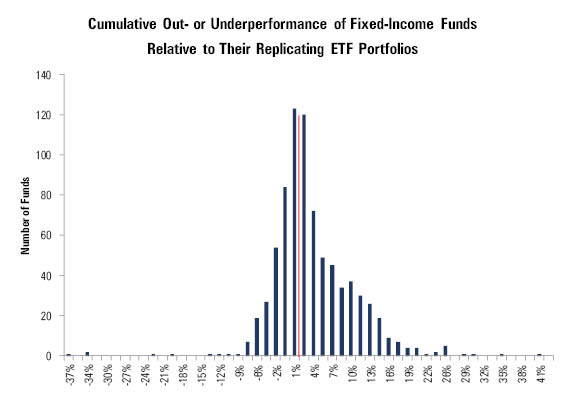
The exhibits below show the number of funds that, during the five-year period of our study, out- or underperformed their replicating portfolio by a given cumulative amount, plotted on the horizontal axis. (The red lines are not part of the fund count; they just mark the zero-outperformance point.)
- Source: Morningstar.
- Source: Morningstar.
Even from just looking at the shapes of these distributions you can see that equity funds skew to the left and most funds show negative values, while bond funds skew to the right and show positive values. The precise numbers are as follows: 65.48% of fixed-income managers outperformed their replication strategies, but only 17.91% of equity managers did.
The mean and median cumulative outperformance for actively managed fixed-income funds versus their passive counterparts was 2.92% and 1.61%, respectively; somewhere between 30 and 50 basis points per year. Not great, but respectable. For equity funds, the mean and median were negative 14.19% and negative 12.11% annualized. That equates to some 240-280 basis points of annualized underperformance.
What the Results Tell Us The most obvious conclusion from these results is that it is much harder to get good results from portfolios built with passive ETFs in the fixed-income field than it is in equities. The difference is striking. Nearly two thirds of bond funds did better than a matching best-fit portfolio that could have been created out of bond ETFs. Less than one fifth of equity funds did.
I'm sure this will bring big smiles to active bond managers. Are they smarter than their equity counterparts? That is hard to believe, though the bond world tends to be much more technical and math-heavy that the equity world. The answer, I believe, is far more prosaic.
Fixed-income ETFs are just not as good as equity ETFs at replicating either the fixed-income universe as a whole or the specific sectors they cover. There are several reasons. One is the sheer size and complexity of the fixed-income markets. There are somewhere north of 100,000 stocks across the globe. And while company stocks are occasionally issued or go kaput, most companies have no more than a few classes of stock. But it's not just companies who borrow money by selling bonds. Bond issuers run the gamut from large countries to mortgage lenders to the retirement center down the street--and they're constantly issuing new ones and retiring the old. There are millions of bonds.
This is not just an issue for ETFs; sometimes there are simply no good indexes at all to track a particular segment of the bond market. For example, there are no readily available indexes tracking nonagency residential mortgages, which many managers have used to generate strong returns since the 2008 financial crisis.
The other side of that coin is liquidity. Most bonds trade occasionally, infrequently, or not at all. For this reason, bond ETFs--which promise continuous liquidity by trading on exchanges--typically steer toward the more-liquid segments of their markets. Active managers may have the luxury of holding less-liquid bonds and earning extra returns from a so-called liquidity premium. Finally, there is the issue of timing and the difference between primary and secondary markets. Buyers purchase securities when they're first sold in the primary market; the secondary market involves the trading of bonds that have already been issued. In the bond world, keeping tabs on origination and underwriting is part of most bond managers' everyday lives. They try to get there first, and they may even be able to influence the terms of a deal. Bond managers may and do buy in primary market. Bond ETFs, on the other hand, always get there after the fact--they have to buy in the secondary market.
And the amount of money flowing through primary markets each year can be staggering. According to the Securities Industry and Financial Markets Association, total U.S. bond issuance totaled almost $7 trillion in 2016. By comparison, the total issuance of new equity in the United States in 2016, counting all true IPOs, secondary offerings, preferred stocks, and closed-end funds, totaled $197 billion.
Many fixed-income managers have expressed the view that the ETF threat to active management is more of an equity phenomenon. The evidence seems to support that contention. That certainly does not spell the doom of fixed-income ETFs, which attracted $80 billion in new flows in 2016. In fact, many asset managers even find them useful. When they receive substantial inflows, for example, some active managers buy high-yield ETFs to quickly gain exposure to the asset class until they can deploy the money to individual bonds they like. An ETF that covers a well-defined, relatively generic, liquid subset of the market may be the way to go for individual investors, as well. But ETFs do look less attractive for a long-term allocation to the totality of the fixed-income market. For those who have taken to using ETFs exclusively across their portfolios, it may pay to re-examine that enthusiasm.
/cloudfront-us-east-1.images.arcpublishing.com/morningstar/ZKOY2ZAHLJVJJMCLXHIVFME56M.jpg)
/cloudfront-us-east-1.images.arcpublishing.com/morningstar/IGTBIPRO7NEEVJCDNBPNUYEKEY.png)
/cloudfront-us-east-1.images.arcpublishing.com/morningstar/HDPMMDGUA5CUHI254MRUHYEFWU.png)
:quality(80)/s3.amazonaws.com/arc-authors/morningstar/fadee740-dfeb-494d-95b1-c462d0ac1f59.jpg)