
Are Factor Investors Getting Paid to Take on Industry Risk?
Industry tilts appear to pay off for momentum but are not integral to the success of value and low-volatility strategies.
/s3.amazonaws.com/arc-authors/morningstar/56fe790f-bc99-4dfe-ac84-e187d7f817af.jpg)
/s3.amazonaws.com/arc-authors/morningstar/64dafa24-41b3-4a5e-aade-5d471358063f.jpg)
In the world of factor investing, industry tilts are often an afterthought. Factor investment strategies systematically target stocks with characteristics that have historically been associated with better risk-adjusted performance. But they often end up with industry weightings that differ from the market's. This article summarizes a study Morningstar conducted to evaluate whether such industry tilts contribute to the success of value, momentum, and low-volatility factor strategies, or whether they are an uncompensated source of risk. The full article is available in the Research Library on Morningstar's corporate website.
Summary The results of this study suggest that:
- Value and low-volatility investment strategies demonstrate persistent industry tilts, which do not significantly enhance their performance. Investors can reduce active risk without significantly hindering performance by constraining these factors' industry tilts.
- Momentum strategies perform best when industry weightings are left unconstrained. This is because momentum's industry weightings are dynamic, allowing it to effectively capture short-term persistence in industry performance leadership.
Research Design To assess whether an industry-relative approach to factor investing is prudent, this study investigates whether tilting toward industries with stronger value, low-volatility, and momentum characteristics provides better performance. In that vein, we constructed value, momentum, and low-volatility factor strategies applied to both individual stocks and entire industries. Each factor strategy measures 50 years of monthly returns from December 1966 through November 2016, using data from the French Data Library. The stock-level factors ignore industry membership, so they can have industry tilts that may contribute to their performance. However, comparing the performance of the stock- and industry-level factor strategies helps illustrate the impact of those industry tilts.
The French Data Library sorts all U.S. stocks listed on the New York Stock Exchange, American Stock Exchange, and Nasdaq exchange into deciles at the end of June each year based on their book/price ratios from the prior year-end. We measured the stock-level value factor performance as the return difference between a market-cap-weighted portfolio of stocks in the cheapest five deciles and those in the most expensive five deciles.
We applied a similar approach to measure the industry-level value factor performance. Instead of ranking stocks, we ranked the 12 Standard Industry Classification industries at the end of June each year based on their book/price ratios from the prior year-end. The industry-level value factor performance is calculated as the return difference between a market-cap-weighted portfolio of the cheapest six industries and the most expensive six industries.
The stock- and industry-level momentum and low-volatility factors follow a similar approach. The momentum factor portfolios for both the stock and industry level were formed based on their prior 12-month returns, excluding the most recent one, and rebalanced monthly. This is consistent with the standard academic measure of momentum. The low-volatility factor portfolios were also refreshed monthly, based on each group's daily volatility during the preceding 60 trading days. While several low-volatility strategies, such as
Results Exhibit 1 shows the annualized performance of the stock- and industry-level versions of each factor. While the stock-level value factor earned a respectable 2.36% annualized return over the 50-year sample period, the industry-level value factor posted a small negative return. This suggests that industry tilts did not contribute significantly to the performance of the broad value strategy. Despite the gap between the two value factor returns, they were highly correlated. (The correlation coefficient was 0.78.)
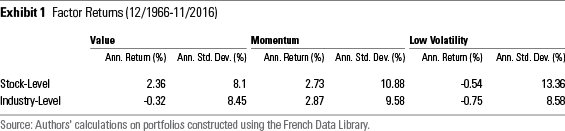
Industry tilts did not help the value factor's performance, likely because they were fairly static, as illustrated in Exhibit 2. This table shows the percentage of time each industry appeared in the long side of each factor portfolio. To illustrate, the energy industry ranked in the cheaper half of the 12 industries 86% of the time, while the healthcare industry only fell in the cheaper half 2% of the time. Industry performance can diverge, particularly over short time frames. But it appears that returns across industries are not strongly related to their (price/book) valuations. Differences in business models, asset intensity, and accounting practices can make such valuations tough to compare across industries. Therefore, industry-relative valuations should contain more information about expected returns than valuations across industries. Our results are consistent with this pattern.

The industry-level momentum factor performed much better than its value counterpart. It actually generated a slightly higher return than the stock-level momentum factor with marginally lower volatility. Momentum's industry tilts are more dynamic (as shown in Exhibit 2) than the value or low-volatility factors and seem to contain greater information about future expected returns. For example, differences in growth rates and capital structures will almost always cause the financial services and utilities industries to trade at lower valuations than the technology and healthcare industries. However, industry performance leadership is often a short-term phenomenon. The high-turnover momentum factor captures this effect, while the value factor is slow-moving. These results suggest that ignoring industry momentum would reduce the efficacy of a momentum signal.
Neither the stock- nor the industry-level low-volatility factors in this study generated positive returns during the full sample period. However, absolute performance is not the best way to measure their efficacy. By definition, less volatile stocks and industries are not as risky as their more volatile counterparts, so it is better to assess the low-volatility factor's success by its risk-adjusted performance. Exhibit 3 shows the performance data for the low- (long) and high-volatility (short) portfolios used to create the stock- and industry-level factors.
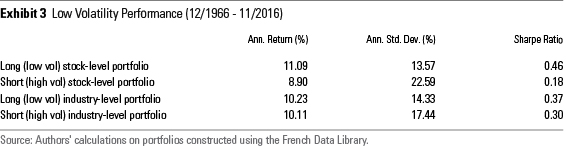
The 50-year compounded return spread between the low- (long) and high- (short) volatility portfolios differs slightly from the factor returns. This is because the factors were calculated from the monthly spreads between the long and short portfolios, which allows them to compound at a slightly different rate than full period spread between the two portfolios. The two industry-level portfolio returns were comparable, but the low-volatility portfolio exhibited a lower standard deviation, resulting in better risk-adjusted returns (as measured by its Sharpe ratio). However, the stock-level low-volatility portfolio had a much stronger absolute performance relative to its more volatile counterpart. Not only did it enjoy a substantially lower standard deviation, but it also posted stronger returns.
These results suggest that while a low-volatility factor can be successfully implemented at both the individual stock and industry level, it has historically been more effective at the stock level. This is likely because there is greater variability in volatility across stocks than industries. While stock-level low-volatility strategies still tend to skew toward defensive industries, this dispersion allows them to realize a greater reduction in volatility than the industry-level strategy.
Consistent with the value and momentum factor results, the industry- and stock-level low-volatility factors were highly correlated during the sample period. (The correlation coefficient was 0.66.) However, the industry-level low-volatility factor underperformed (generated a negative alpha) after controlling for its exposure to the market risk, size, value, and stock-level low-volatility factors. This further indicates that the low-volatility factor has been more effective at the stock level.
Not surprisingly, the industry-level low-volatility factor consistently favored the consumer nondurable (consumer defensive) and utilities industries, and generally avoided the business equipment (which includes technology stocks) and consumer durable (consumer cyclical) industries. However, its industry tilts were not as consistent as the value factor's.
Conclusion The results of this study suggest that it is sensible to make industry adjustments for factor strategies with persistent industry tilts, like value and low volatility, because these tilts don't contribute significantly to these strategies' long-term success. However, it is best to leave industry tilts unconstrained for momentum strategies, because they can capture short-term industry performance persistence. Even without a performance benefit, industry constraints allow investors to mitigate unintended bets. This comes at the cost of lower factor style purity, higher turnover, and greater complexity. In many cases, it's worth the trade-off.

Disclosure: Morningstar, Inc. licenses indexes to financial institutions as the tracking indexes for investable products, such as exchange-traded funds, sponsored by the financial institution. The license fee for such use is paid by the sponsoring financial institution based mainly on the total assets of the investable product. Please click here for a list of investable products that track or have tracked a Morningstar index. Neither Morningstar, Inc. nor its investment management division markets, sells, or makes any representations regarding the advisability of investing in any investable product that tracks a Morningstar index.
/cloudfront-us-east-1.images.arcpublishing.com/morningstar/T2LGZCEHBZBJJPPKHO7Y4EEKSM.png)
/d10o6nnig0wrdw.cloudfront.net/04-18-2024/t_34ccafe52c7c46979f1073e515ef92d4_name_file_960x540_1600_v4_.jpg)
/d10o6nnig0wrdw.cloudfront.net/04-09-2024/t_e87d9a06e6904d6f97765a0784117913_name_file_960x540_1600_v4_.jpg)
:quality(80)/s3.amazonaws.com/arc-authors/morningstar/56fe790f-bc99-4dfe-ac84-e187d7f817af.jpg)
:quality(80)/s3.amazonaws.com/arc-authors/morningstar/64dafa24-41b3-4a5e-aade-5d471358063f.jpg)