
Consumers Feeling the Pain of Lower Incomes
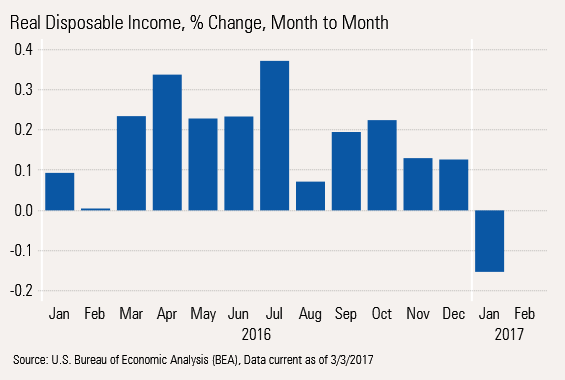
Real disposable income growth is down considerably from a year ago, potentially providing less firepower for consumption growth ahead.

U.S equity markets did well this week, gaining about 0.7%. Most of the week's upside action occurred around President Trump's mid-week address to Congress, which sounded both more hopeful and presidential. But details were still lacking.
Markets, also in a change of pace, liked a more hawkish Fed based on recent speeches by several Fed members over the past week. A more tightfisted Fed suggested that the economy was even stronger than the market already believed, which is why the equity markets, not the bond markets, reacted so positively to a potential Fed rate increase in March. The odds of a March Fed rate increase, based on interest rate futures, were close to zero two weeks ago, then hit the mid-20s last week, and rose to over 60% this week.
We aren't quite so sure that the economy is as strong as the market and the Fed think. Nevertheless, with inflation up and markets already pricing in an increase, the Fed will likely take the opportunity to raise rates sooner than later. Other than the housing market, we don't foresee any big economic effect from this change.
A lot of the economic indicators weren't that hot this week. Motor vehicle sales were down 1% year over year, inflation-adjusted consumption was down 0.3% month to month, and new durable goods orders were down month to month. New construction data, which we don't discuss, was also down. Nevertheless, purchasing managers continued to party on with unbridled optimism, as the ISM index hit a new three-year high. We explain the dichotomy in this week's column. And the stock market, often viewed as a leading indicator, also moved ahead.
The purchasing manager and stock market optimism seem to be based on potential economic policies and not current conditions. If broad-based regulatory, tax, and stimulus policies are indeed enacted, our relative pessimism (we are predicting slower growth than most, not another recession) may prove to look a bit silly.
Month-to-Month Consumption: Not Good but Not Quite as Bad as It Looks Personal consumption data is one of the most important pieces of data that economists receive each month. It is one of the few data sets that comes already adjusted for inflation/deflation, which has made it easier to analyze than a lot of other monthly reports, especially retail sales. And at 70% of total GDP and more than 100% of the growth in full-year 2016 (because other key sectors declined), it just cannot be ignored.
However, the report is always a month late. The current report was for January, and we already have auto sales, some sentiment data for manufacturing, and weekly shopping center data for February.
Inflation-Adjusted Consumption Misses the Mark in January Inflation-adjusted consumption was down 0.3% between December and January, even worse than we anticipated. Uncharacteristically, the market largely ignored the negative data, perhaps because the four previous months of data were quite good and above expectations.
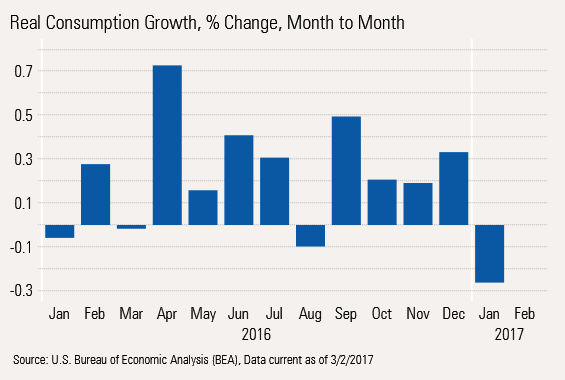
Fed speakers didn't really seem to get the message, either, with a much more hawkish tone this week despite another batch of lukewarm data. A lot of economists took a great deal of solace from the fact that the volatile utility sector was responsible for a great deal of the consumption decline. And expectations weren't high given the utility issue, slower car sales, and mediocre inflation-adjusted retail sales.
We wouldn't be too quick to brush off the consumption numbers as an unimportant statistical accident. First, a lot of the January problem areas look to be just as bad, if not worse, in February. The month of February will go down as one of the warmest in history. In terms of temperatures, February will likely go up as much as 20%-25% above normal, while January was only 15% above normal. That means that utilities will be a significant subtractor again in February.
Also, auto sales are likely to be a detractor from consumption again in February, or at least not an adder given the recently released February sales data.
However, it wasn't all about two specialty items. Besides utilities and motor vehicles, clothing, furniture, gasoline, and recreational services were down for the month. And healthcare growth was still high, but lower than it was a year ago. So we strongly disagree with those dismissing the poor consumption data for January as a one-off event.
Further bolstering our worries was income and wage data for January that was also down month to month. We had warned that this might be an issue because of sharply higher inflation and slower hourly wage growth. The normally tame personal consumption deflator showed month-to-month inflation of 0.4%. That is better than the CPI calculation of 0.6%, but still more than we are used to seeing. The CPI gives more weight to gasoline and healthcare, two areas that have seen large increases.
With what we now know about January consumption and a lot of the key data for February, we believe quarter-to-quarter consumption growth will slump from its norm of close to 3% to 1.5%-2.0% or so. If one month of bad data doesn't get people upset, maybe a full quarter's worth of data will do the trick.
Taking the Longer View, Consumption and Income Growth Are Lower and Converging Things look a lot less dire, but still slowing if we look at our year-over-year, averaged data. Year-over-year consumption growth was 2.5% last January and is now at 2.9%, but that is still lower than the 3.7% rate of January two years ago. More notable is that wages and especially real disposable income growth are down considerably from a year ago, potentially providing less firepower for consumption growth in the months ahead. Next week's report on employment and wages for February will show if this trend has potentially been arrested.
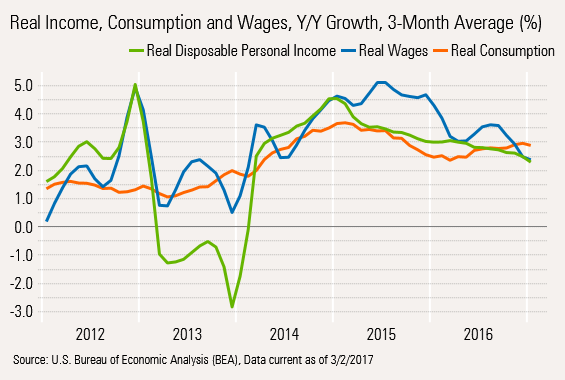
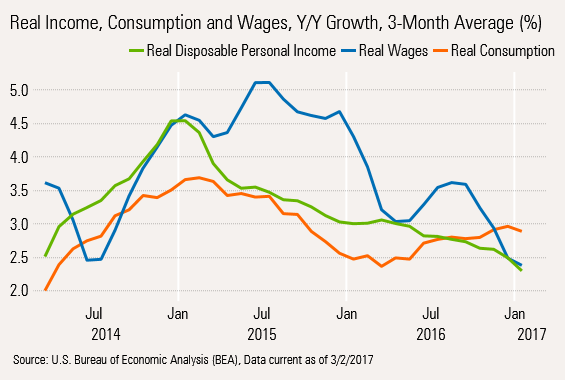
We have also blown up the graph using a shorter time period and setting the base higher than zero to show how far real wages and incomes have slumped from the previous peaks. The 2012 and 2013 data show the effects of the removal of the Social Security tax holiday and new tax laws, which are other reasons to skip the full five-year analysis period, our normal default.
Motor Vehicles Have Been a Volatile but Key Factor in GDP Growth
Motor vehicle sales for February were released this week. Before we dive into the numbers, it is important to remember why motor vehicle sales are so important to our analysis. After 2010 (a year which includes an artificial post-recession bounce), motor vehicles accounted from 0.06% to 0.31% of annual GDP growth. That is nothing to sneeze at in a world of 2% growth. And because of the government's inability to get the seasonal adjustment factors right, the quarter-to-quarter contribution has ranged more widely, from a negative 0.4% to a positive 0.6%.
Light Vehicles Is One Consumption Category That Is in Trouble
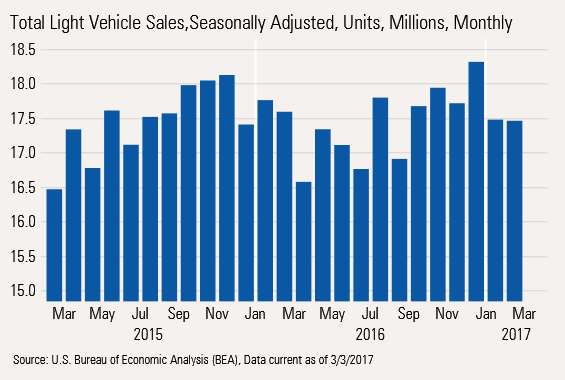
Units sales at 17.46 million for February were flat with January but down from 17.76 for January a year ago, or down 1.7%. Both 2015/16 and 2016/17 sales were artificially strong in the fourth quarter only to be followed by an unusually weak first quarter. Buying patterns have changed; the seasonal factors haven't. The weaker year-over-year data came despite incentives that continue to go up at double-digit rates (14% in February alone). At $3,443, incentives now represent just a tad over 10% of the average price of a new vehicle at $34,352.
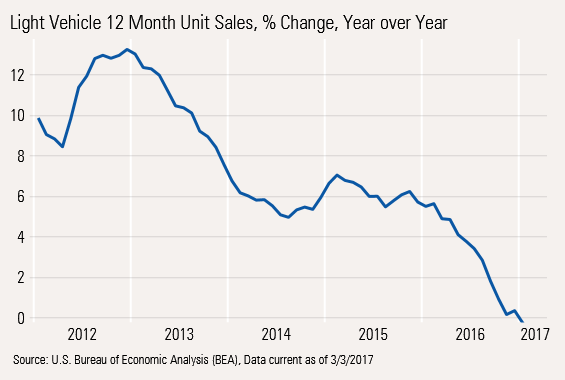
Trailing 12-Month Sales Growth Doesn't Leave a Lot of Room for Hope Rolling 12-month sales growth is now below zero despite all those incentives after peaking at over 13% growth in 2012.
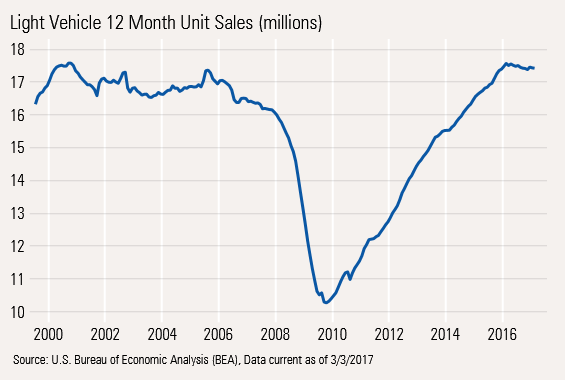
Long-Term Picture Shows Potential Saturation Issue
We have noted in the past that current unit sales are now at previous historic highs dating back to 2000. Sales in 2000 were about identical to where we are now. One might hold out some hope for improvement given today's population is about 15% higher. That could happen. Still, our view is that longer lasting cars, Uber, and much higher prices relative to incomes will limit unit sales to former highs. Most analysts continue to expect no unit growth in 2017 compared with 2016.
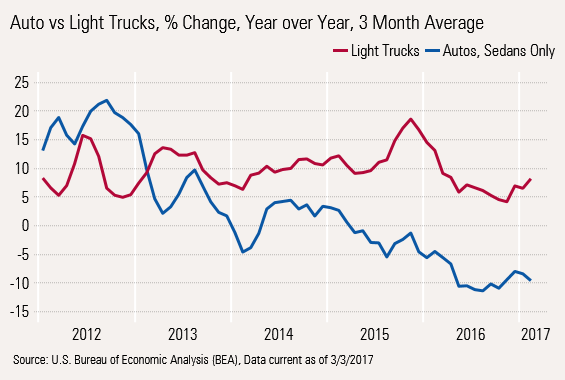
We do note that because of a shift to more expensive pick-up trucks and cross-overs that sales dollars and even profit dollars may continue to move higher. However, all of this depends on manufacturers being able to switch capacity to the more popular light truck production. We can already see passenger car inventories swelling. The graph below shows the huge shift to the light truck market. Sedan sales are down 10% and light truck/crossover/SUV sales are up 10%.
Purchasing Manager Surveys and Durable Goods Orders Send Mixed Messages on Manufacturing
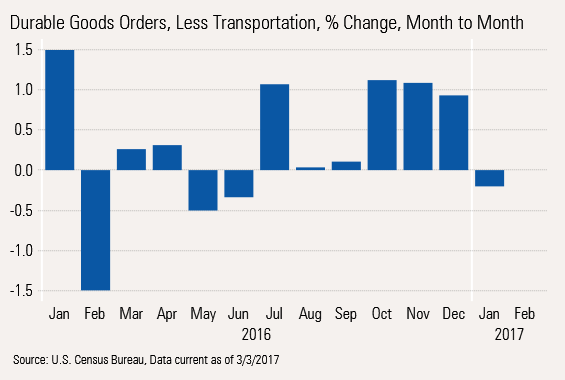
The big disconnect in this week's data was between new orders for durable goods for January and the ISM Purchasing Manager Survey for Manufacturers. The new order data, which is for the entire month of January, was down between December and January. However, the monthly pattern had generally been up over the last four months.
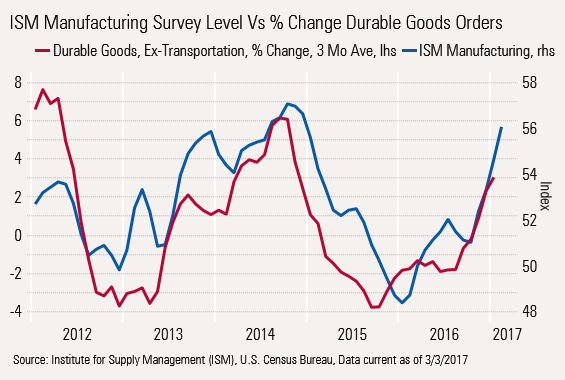
Meanwhile, the ISM reading, taken in mid-February, was downright ebullient and unequivocal with a reading of 57.1.
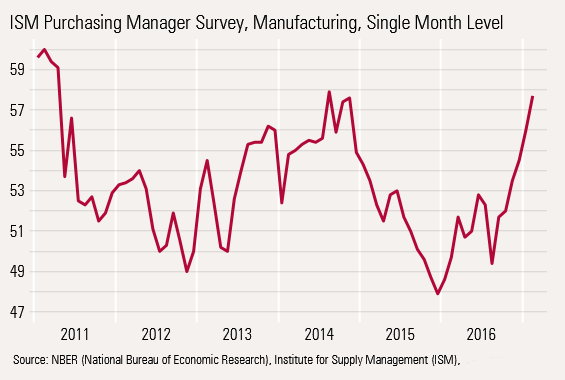
The report has shown consistent improvement since August, indicating that while this may be a one-month wonder, the trend is clearly established. The data was extremely "internally consistent." Of the 18 categories, only one was in decline. New orders, production, and prices all looked sharply up. Employment, while still at a high level, did back off a bit in February, which is the only thing that struck us as inconsistent with the strong report.
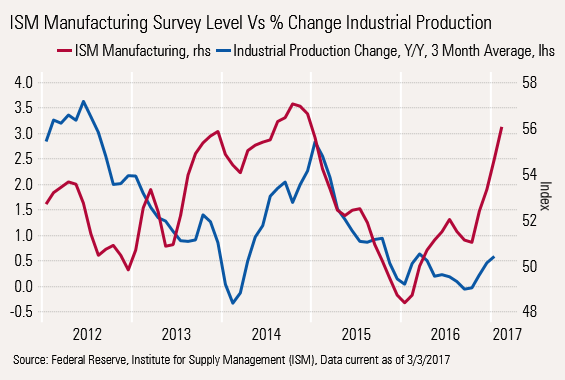
The last time the reading was above 57 (it peaked in October 2014; 57 on a three-month moving-average basis) industrial production peaked at 3% growth three months later. Currently, industrial production on a year-over-year three-month moving-average basis, was just 0.6% in January, suggesting a lot of upside potential, some type of data error, or survey takers were in a really good mood on the day they filled in the survey.
There are two items that suggest potential issues with the ISM data: a less bullish Markit survey and the above mentioned durable goods orders report.
Markit Survey Down for February and at a Lower Level The Markit data, which uses different weights for five key subcategories (versus equal weight for the ISM), produced a different, though still quite bullish picture.
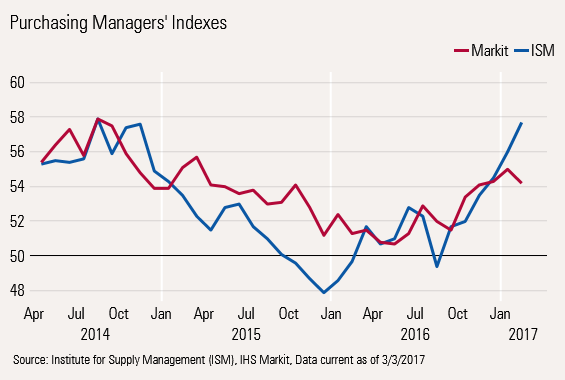
Interestingly, in 2014, when both indexes notched identical peaks of 57 (on a three-month moving-average basis), industrial production, and manufacturing was closing in on 3% growth.
New Order Growth More Consistent With a More Tempered Growth in Manufacturing Plotting the growth in new orders for durable goods against industrial production for manufacturing demonstrates an improving but not fantastic recovery, as shown below.
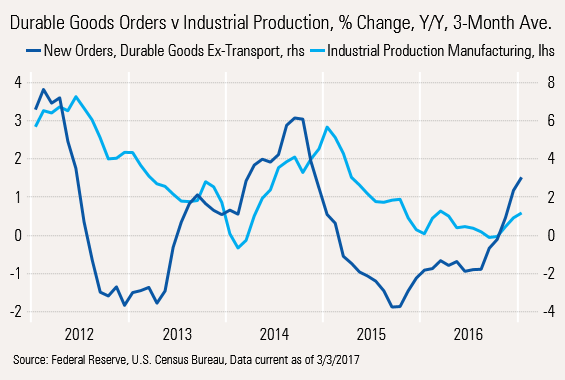
New orders for durable goods seem to provide a good relationship with industrial production, and provide greater lead time than the ISM data. The new durable goods orders signal also seems clearer and less subject to big reversals than with the ISM. Note the red line below shows new orders moving consistently before the ISM data.
The new order growth is suggesting industrial production growth of about 1.5%. That's better than the 0.6% level we are at now, but not as good as the 3% level that the ISM data suggests. In other words, the slow quirky manufacturing recovery continues, but certainly not at a strong enough level to help manufacturing employment growth.
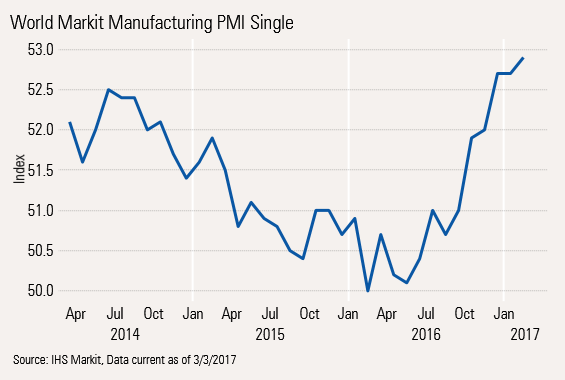
Improvement in World PMI Data Should Help Some, Too Manufacturers often sell their products to other manufacturers. U.S. and German manufacturers are known for selling a lot of capital goods to other manufacturers around the world. Therefore, it is a helpful sign that the overall PMI rating for the world economy is continuing to trend up. That index has been increasing since June 2016.
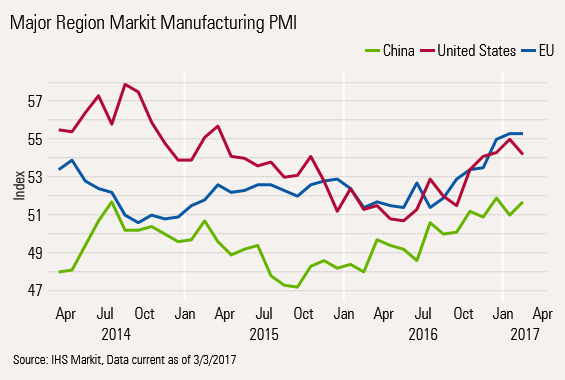
The European reading continued to improve in February, though a big jump in the German reading was responsible for most of the tiny improvement. China also continued its improvement that has been moved up in a jagged, stair-step pattern since the middle of 2015. However, the Chinese reading didn't clearly move into growth territory until mid-2016 with consistent readings above 50. The U.S. data held back the numbers modestly with the small Markit decline that we detailed above. Remember, that a lot of economies outside the U.S. are more dependent on manufacturing than the U.S. for growth.
/cloudfront-us-east-1.images.arcpublishing.com/morningstar/T5MECJUE65CADONYJ7GARN2A3E.jpeg)
/cloudfront-us-east-1.images.arcpublishing.com/morningstar/VUWQI723Q5E43P5QRTRHGLJ7TI.png)
/d10o6nnig0wrdw.cloudfront.net/04-22-2024/t_ffc6e675543a4913a5312be02f5c571a_name_file_960x540_1600_v4_.jpg)