
Inflation Pushes Higher, Endangering the Recovery
Barring a disaster, inflation should peak around midyear but stagnant wage growth means there isn't much relief for consumers in sight, says Morningstar’s Bob Johnson.

This month, the economics calendar aligned in a bad way with most of the major data releases coming this week, and many of those on Wednesday. We had to triage this week's reports and I will be focusing on the inflation, retail sales, and industrial production reports. Inflation took its expected turn for the worse with month-to-month inflation up 0.6% and 2.5% year over year. January could be the worst of the month-to-month news. Let's hope so; the month-to-month data annualized to over 7% inflation. The year-to-year data still has a couple of bad months ahead of it, with a chance of hitting 3% inflation in February. The core inflation rate is trending up, as is inflation excluding just gasoline prices, but not nearly as much as the headline number, and not alarmingly so. I still worry about the impact of even small inflation increases on the consumer.
Retail sales looked surprisingly good, at least until I matched the sales data with the Consumer Price Index report. Taking that extra step shows acceptable retail sales but not the barn-burner that many pundits have described. Combining low utility usage, OK inflation-adjusted retail sales, and poor auto sales in January, we would not be surprised if January consumption data, to be reported in March, could be down on an inflation-adjusted basis.
Industrial production was another disappointment for those hoping for a big rebound based on optimistic purchasing manager surveys. Year-over-year, averaged production is improved but still just a pathetic 0.5% or so, with no clear path to improvement.
Some of the housing data looked somewhat better this month, mainly on the single- family side. At least higher interest rates didn't seem slow things much and builder sentiment dropped only slightly off of very elevated numbers. Also, some international growth projections looked a bit higher this month, especially in Europe.
Fed Chairman Janet Yellen offered up that the economy was doing well and most likely justified more slow increases in rates in 2017. I am not sure that a close reading of recent economic data is entirely in her optimistic camp as I outline in this week's data.
(That said, she has more access to data than I do, so her optimism may be well-placed and I may be too pessimistic.)
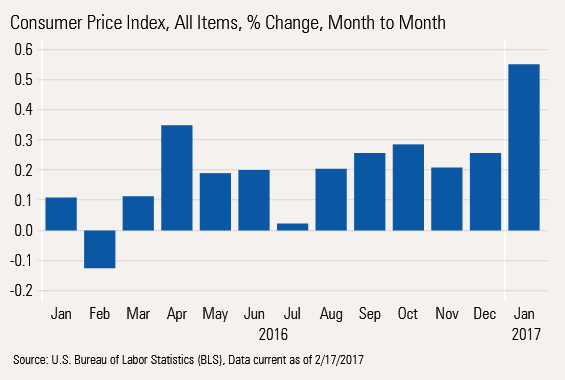
We have been warning for most of the past six months that rising gasoline prices would have a major impact on the CPI, especially in January and February when year-ago prices were at bargain-basement levels. Those fears came home to roost with the release of the January CPI that showed month-to-month headline inflation jumped to 0.6% versus expectations of just 0.3%. Even the month-to-month graph shows total inflation has been 0.2% or higher for six consecutive quarters. So, even before the gasoline spike in January, annualized inflation was averaging 2.5% or so, higher than many people seem to realize and not that much higher than recent wage growth.
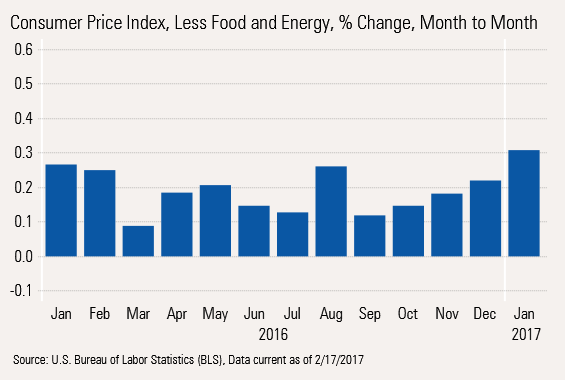
Even core inflation, excluding food and gasoline, came in at 0.3% (3.6% annualized) versus market expectations and trend line data that were running at about 0.2%. Note that even in the monthly data, a pattern of higher core inflation seems to be building. Since September, core inflation has moved from 0.1% monthly to 0.3%.
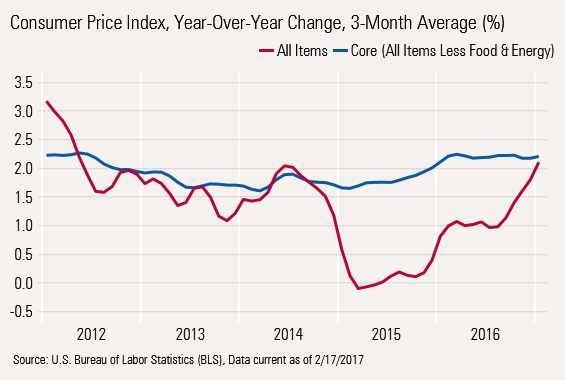
Year-Over-Year, Averaged Inflation Data on the Rise, Too We have been talking about the convergence of core inflation rates and total inflation data for some time. For the past few months we have used arrows to show the likely convergence of the two data sets. This month we don't have to use any arrows; core and total inflation on an averaged basis are now 2.1 and 2.2%.
Looking Ahead, the Best Case Suggests That Headline Inflation Peaks at 3% in March Before Drifting Back to 2% If were to peek ahead, the news gets worse, at least for a while. We get our first hint if we look at a single-month year-over-year rate, instead of using our tamer averaging method. Look at a single-month, core inflation was up 2.3% and total inflation has pulled ahead with a year-over-year rate of 2.5%. So, single-month data seems to suggest things may get worse before they get better. The single-month numbers (instead of the averaged, all-in data) is shown in the far right column below.
Single-Month Data Trend Data and Higher Gasoline Prices Indicate February and March Could Be Bad Gasoline is also likely to make things worse, at least for a little bit. First, looking at past data we can see that gasoline has a massive impact on the CPI even though it represents only 3% or so of the index. That is because we have seen such large, panic- like moves periodically. As an example, in July 2016 gasoline prices were down 20% year over year. Multiplying by a 3% weight, a 20% drop in gasoline prices single-handedly took off 0.6% from the CPI calculation (.03 times 0.2 = 0.6%). Solely leaving out gasoline, other prices in July 2016 were up 1.5%. Fast-forward to January 2017, when gasoline prices were up 20%, gasoline added 0.6% to the CPI and the CPI without gasoline was up a slightly higher 1.9% in January versus July. So headline inflation went from just 0.6% to 2.5% in just six months' time.
Gasoline's Severe Impact on the CPI
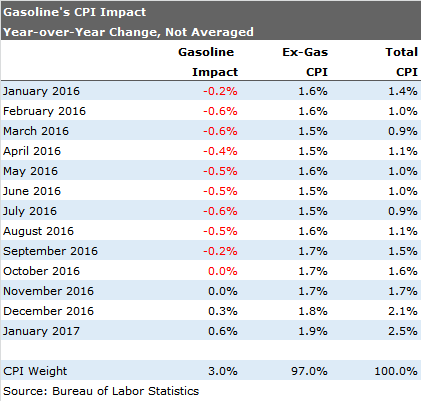
It also appears, based on price data through Feb. 17, that gasoline prices will be up just under 30% in February, versus "only" 20% in January. On a single-month basis that means gasoline inflation will potentially add another full percentage point to year-over- year CPI data, versus 0.6% in January.
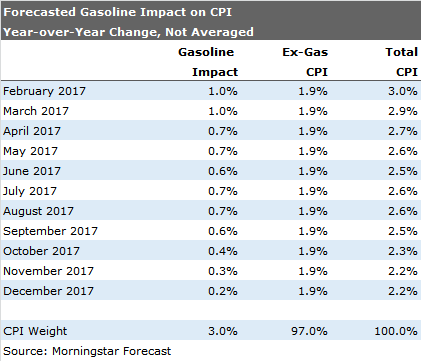
That means that there is the potential for headline GDP to touch 3%, year-over-year change for the single month of February with the potential for a repeat performance in March, before the gasoline impact begins to diminish. Assuming all other category inflation levels stay about the same, headline inflation could drop from 3.0% in March to perhaps as low as 2.2% by year end 2017. Of course, all of that assumes that gasoline prices stay flat on a seasonally adjusted basis and don't spike again. It also assumes that other price data looks relatively similar to recent results, also a somewhat hopeful case. Note the 1.9% non-gasoline related inflation level is merely a repeat of the January, 2017 level and not any kind of thoughtful forecast. On the other hand, it probably isn't a terrible guess, with labor inflation likely to move parts of the CPI higher, potentially offset by lower housing inflation as rent inflation looked a little tamer in January. However, a crop failure anywhere around the world, a weakening dollar or a mini boom in commodities related to a stronger world economy and potential U.S. stimulus all have the potential to move inflation higher.
Pulling out gasoline was an interesting exercise that surprised even us. Gasoline prices have an unusual and disproportionate effect on inflation. And gasoline was one of those categories where usage varies a lot depending on location and lifestyle. Young urban single folks may not use much gasoline. Ranchers in the heartlands may use a lot. And lower-income folks also tend to spend a greater portion of their income on gasoline.
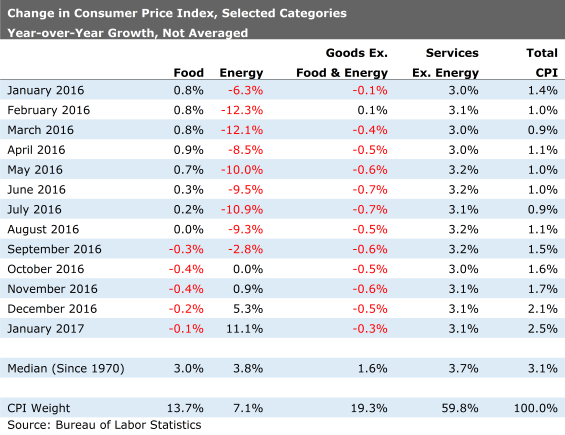
Services inflation has remained more stable than we might have guessed, though it is still stuck at a relatively high level. The good news is the rent and owner equivalent increases seem to be moderating as more apartment buildings come on line. Shelter accounts for half of the services category. Healthcare inflation also still looks quite high, but the month-to-month data has stabilized over the past five or six months after a huge surge over the summer. We aren't sure if that better behavior is due to faulty seasonal factors, more moderate demand (not likely), or a race last summer by vendors to raise prices before a new president with a potentially more aggressive approach to healthcare pricing was elected. Some of those fears continue to manifest themselves in healthcare stocks prices, one of the worst-performing sectors in 2016.
Are Food Prices Not Going Down Anymore? Food prices, which helped mask inflation in other categories last year, also appear to be going back in the other direction again, primarily as a result of higher restaurant prices, a potential unintended consequence of higher minimum wages in some regions. Though, even grocery store prices were no longer going down between December and January. Meat prices were up some again in January after a string of declines. Given the nasty storms hitting California yet again, we remain a bit worried about what may happen to food prices next month.
Goods Prices Make an Uncharacteristic Jump in January The normally tame good category looked horrible between December and January (up 0.4%) which even managed to pull the year-over-year averaged data to a higher level than we are used to seeing. A strong dollar and the large number of imported items in the goods category have generally helped push the goods category down. While we will watch the goods category to make sure there isn't something more diabolical going on, we suspect the inflated goods number was a statistical accident and not the start of something worse. Our go-to suspect would be fewer post-holiday sales because retailers were so cautious with their inventories during the holiday season. There was just less stuff to get rid of at discount prices. I really don't think clothing prices went up sustainably by 1.1% in a single month. The auto inflation number didn't make a lot of sense to us either, up 0.9% in a month when auto companies freely admitted to unusually large incentive packages on new cars that should auto-related CPI figure down not up. Even the price of electronics was up sequentially by 0.6% in an industry that generally experiences double-digit year-over-year declines (which translates to a 1% monthly decline).
It Just Doesn't Feel Like Inflation Is Surging While the month-to-month numbers were at least a bit troubling, overall year-over-year trends feel like inflation is stuck around current levels, but just one disaster or shortage away from being a problem. Trending energy data suggests a few more months of pain, however, as those effects fall off this summer food prices seem poised to move higher. We suspect that inflation will peak around midyear, without some new disaster. But ongoing labor shortages, a return to more normal energy markets (when the yo-yo stops) and stronger world demand for commodities likely mean that the consumer will not see all that much relief on the inflation front.
Wage Acceleration Now Appears to Be Not High Enough We have been fearful about inflation for some time, mainly because higher inflation will pinch consumers. While the popular press has been cheering wage increases, and although it has done nice things for consumers, we beg to differ. Wage growth made its big jump a couple of years ago. Since then there hasn't been all that much change. For some time consumers reaped a considerable benefit from a combination of demographically induced wage increases and low inflation.
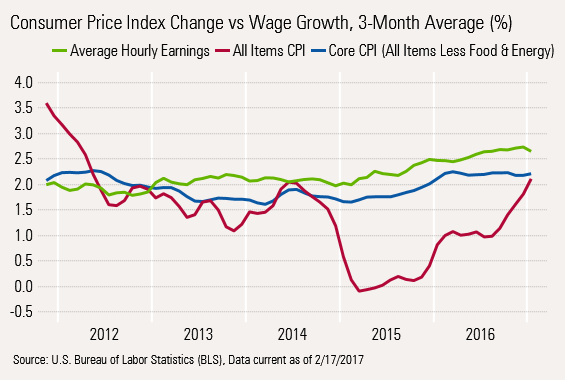
In early 2015, hourly wages were growing at 2.0% and there was, for all practical purposes, no inflation, at least on an economy-wide basis (your personal experience could be different). That wide gap persisted for almost all of 2015. Inflation popped some in early 2016 to the 1% level and wage growth moved to 2.5%, a smaller but still healthy spread. Now wage growth has sneaked up to 2.65% but the all-items CPI is up to 2.11%. After enjoying a spread of more than 2% in early 2015, that spread has shrunk to a meager 0.5% on a year-over-year averaged basis. On a single-month basis the spread has all but disappeared in January with inflation and wage growth hovering around 2.5%.
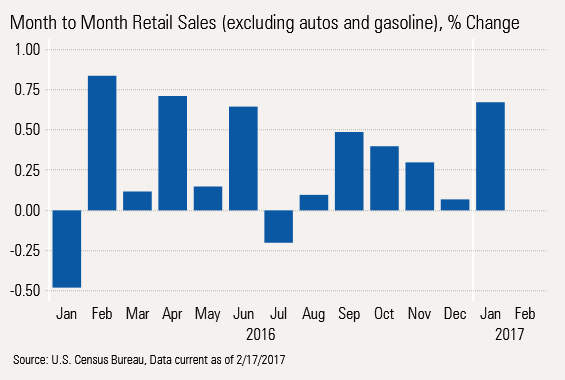
CPI Report Explains Most of the Above-Expectations Retail Sales Number A lot of reporters were really excited by the January retail sales number that showed 0.4% growth between December and January. However, what got everyone salivating was the 0.8% growth rate when those pesky and disappointing motor vehicle sales were excluded from the calculation. However, given the context of some slower growth numbers in recent months and high monthly volatility amplified by a high seasonal adjustment the number wasn't quite as good as it seemed to some. And given that retail sales and auto sales are often inversely correlated (car buyers don't have as much time or money to shop in months when they are out shopping for a car) a strong retail sales number with a poor auto number isn't that surprising. Remember it worked in reverse, too, with strong auto sales in December and poor retails to go with it.
However, we have to admit we still kind of like the numbers. That is, until we did some comparisons to the CPI report. Most of the really strong categories saw an unusually high amount of inflation, especially in relation to December's results. Just to pick on a couple of categories, apparel sales were up 0.1% in December, but making our own inflation adjustment, based on the CPI apparel price decrease for December, inflation- adjusted sales were up 0.5%. The story was completely reversed in January, sales were up a truly impressive 1.0%, that is until one adjusts for even more impressive inflation of 1.4%. This means that clothing sales on an inflation-adjusted basis were down 0.4% in January. The same type of problem was visible in two other star performers: drug stores and furniture. Sales of electronics, groceries, and restaurants also benefited from the higher inflation level, though growth in these categories was still quite impressive.
Adjusted for Inflation Retail Sales, Excluding Autos and Gasoline: Good but not Great We have been adjusting retail sales for inflation on a year-over-year basis for some time. Because of the volatility and the big effects of rounding inflation to one decimal point, we have been a bit reluctant to adjust the month-to-month numbers. Our best guess is that in December, retail sales inflation was zero. In January, that same inflation rate was 0.44%. So adjusting for inflation, retail sales, excluding gasoline and auto sales, were up 0.1% in December and a better but less than inspiring 0.2%. The before- adjustment data was shown in the bar graph above and showed a more dramatic jump from 0.1% to 0.7%.
Year-Over-Year Averaged Retail Sales Growth: Steady as She Goes We thought that given all the comments about the allegedly robust economic numbers, based on month-to-month data, we felt it necessary to explain why the retail sales number was nothing special on a month-to-month basis. We usually try to ignore the monthly data and focus on the year-over-year averaged data shown below. That seems to eliminate some of the random monthly volatility.
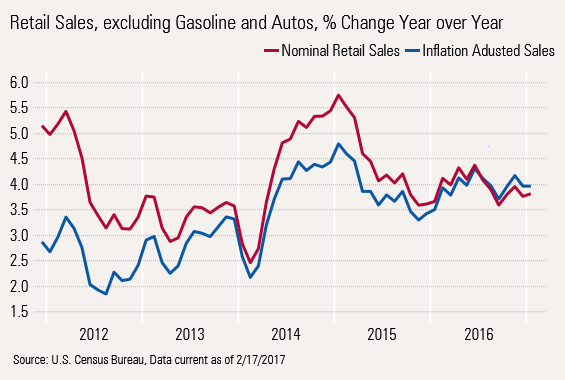
From the beginning of 2016, inflation-adjusted retail sales have been in an exceptionally narrow channel between 3.4% and 4.1%, showing no definitive trend of increasing or decreasing. The good news is that we are at the top of that channel. The bad news is that rate was almost as high as 5% in early 2015. Not at all surprisingly, that is when the gap between hourly wages and inflation was the greatest, as we showed in the inflation section of this report.
Retail Sales Data and Warm Weather Could Doom the January Consumption Report We usually don't worry too much about a single month of consumption data, nevertheless we believe the January report could come as a bit of shocker when it is released March 1. Inflation-adjusted retail sales are a lethargic 0.2%. With the large auto sales category down in units and up in prices, it's quite likely that autos will take away from the consumption report. Combining the retail sales report with auto sales would suggest that goods consumption could be negative. The larger services category has been trending along a tad less than 0.2%, inflation adjusted per month. Still, that growth will potentially be wiped by low utility usage due to unusually warm weather, especially in the Midwest. I am not so sure I am terribly worried about this, but the impact likely continued through February. Utility usage is volatile and not terribly useful in accessing even medium-term trends or moving the employment needle. My worry is that a potentially zero-growth consumption number for January would come as a shock to many--a wake-up call that all is not booming.
Industrial Production Creeps Higher but Fails to Live Up to the Hype We have railed against all the very bullish purchasing manager data for months. This month's industrial production data was modestly better but still is not living up to what the purchasing managers have been expecting.
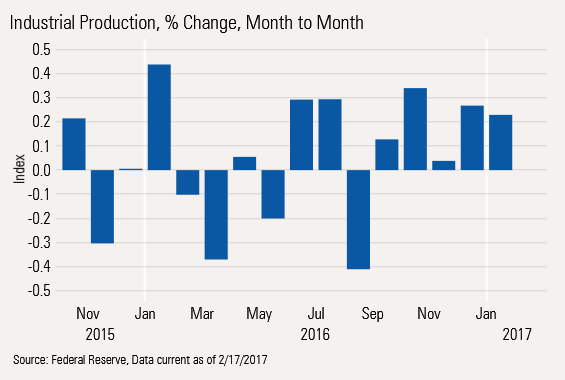
The good news is that industrial production for manufacturing only (no utilities or mining) has strung together five months in a row of month-to-month increases. Still, those month-to-month increases annualize to less than 2%, and that is really cherry-picking the data. But I did want to give the purchasing managers some credit.
The year-over-year data still looks pathetic, but at least the line is moving in the right direction, though at 0.5% growth it is still tugging down overall economic and employment growth rates.
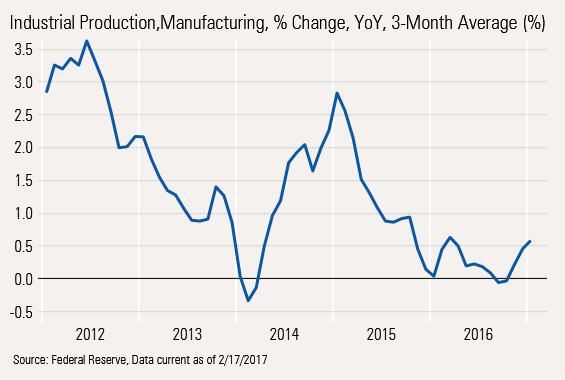
The problem is the sector data fails to show what will lead the sector out of its malaise. Some sectors are still on the decline and some leaders (like autos) are reversing. The strength isn't clear-cut or widespread. Over the last year only computers, a few metals, and machinery are showing an accelerating growth rate. Others, like autos, are destined for further declines.
/cloudfront-us-east-1.images.arcpublishing.com/morningstar/T5MECJUE65CADONYJ7GARN2A3E.jpeg)
/cloudfront-us-east-1.images.arcpublishing.com/morningstar/VUWQI723Q5E43P5QRTRHGLJ7TI.png)
/d10o6nnig0wrdw.cloudfront.net/04-22-2024/t_ffc6e675543a4913a5312be02f5c571a_name_file_960x540_1600_v4_.jpg)