
Is the Worst Over for Troubled Trade Data?
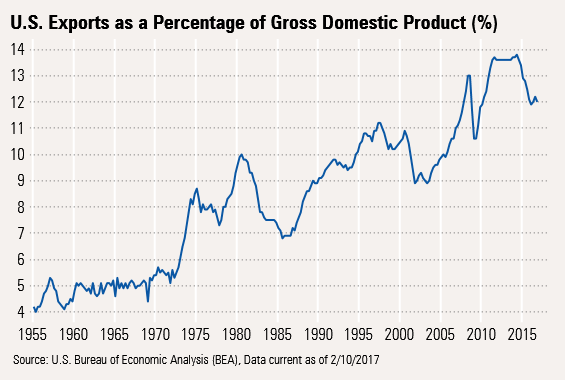
Trade has fallen from close to 14% of GDP to just 12%, a drop that is more typically associated with a recession than a midcycle recovery.

After last week's data whirlwind there is less than usual to talk about. Last week we took a deeper dive on consumption and its main driver, wage income. This week's full-year trade data provides an opportunity to talk about how trade has been affecting GDP. Unluckily, trade has fallen from close to 14% of GDP to just 12%, a drop that is more typically associated with a recession than a midcycle recovery.
While government spending at all levels (about 17% of GDP) is no longer detracting from GDP, it still hasn't provided much of a boost to economic growth. New budget data at the Federal level suggests the current budget situation has improved slightly in 2017, on better revenue collections. And, through the mid-2020s, the Congressional Budget Office dialed back its deficit projections very modestly, but continued to warn that baby boomer retirements followed by growing debt and interest payments will make the debt unsustainable by 2047 if some action isn't taken, hopefully sooner than later.
Trade Numbers Stabilizing After a Bad Fall? Trade and its impact on GDP have gotten a lot more attention lately in the popular press. We thought we might add some perspective to the role of exports to the U.S. economy.
In general, exports have grown faster than GDP since 1955. We can see that exports have moved from just 4% in 1955 to almost 14% in 2015, before backing off to 12% in recent quarters. An increasing share of GDP means that growth in exports is exceeding overall GDP growth. The improvement has been irregular with crosswinds from strength of the dollar, financial crises, commodity cycles, and overall economic growth.
Still, despite growth in the U.S. export share, the percentage of U.S. economic growth driven by exports is much lower than most major economies. In fact, it is not at all unusual for 20% or more of an economy to come from exports compared with 12% in the United States.
The U.S. economy is somewhat unusual in that 70% of economic activity is driven by the consumer.
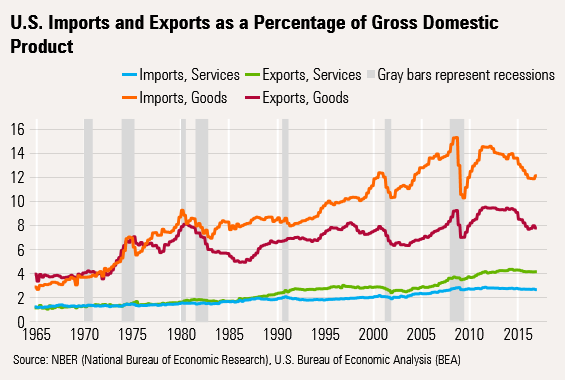
So as much as rising exports have helped, imports have had a boom of their own, going from about 4% of GDP to roughly 15%. Most of the strength in imports has been on the goods side of the equation while the U.S. has gained ground in the service sector.
Even though trade is less important to the U.S than the world economy, the recent slowing in exports has still hurt U.S. GDP growth in recent years. The quarterly data has been exceptionally volatile, seriously messing with the GDP calculation, especially in fourth-quarter of 2016, as shown below. Short-term, wild swings in soybean shipments single-handedly added about 0.8% to GDP growth in the third quarter before giving back that same amount in the fourth quarter. The wild swings are less apparent in the more reliable annual data sets.
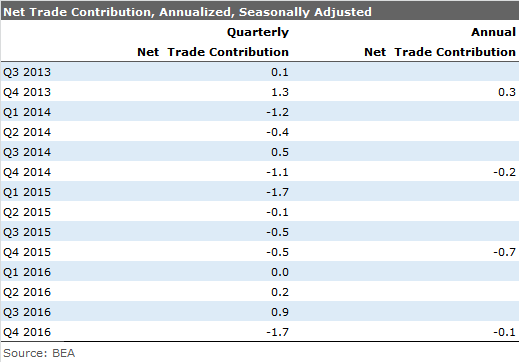
Nevertheless, net trade has been a subtraction to GDP growth in each of the last three years, even on an annual basis. The worst year for annual exports this recovery was 2015, when trade took off a whopping 0.7% from a GDP growth rate that was just 2.6%.
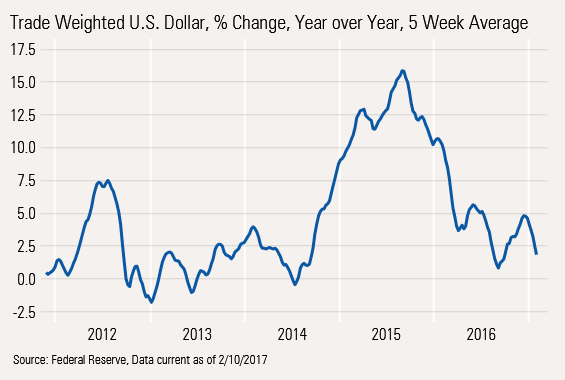
Because imports are larger than exports, and both tend to grow at similar rates in the middle of a cycle, trade is normally expected to take a tenth or two off annual GDP growth in most years. However, 2015 was an unusual year with an exceptionally strong dollar and a commodity cycle bust (the U.S. sells a lot of capital goods abroad that process raw materials throughout the world) combining to do some serious damage to the trade figures. As the dollar stopped rising in late 2015 and the commodity cycle began to stabilize, net exports did a lot less damage in 2016.
More Recent Year-Over-Year Data Suggests the Worst May Be Over for Trade We always like to look at a lot of our data on a year-over-year three-month averaged basis to help spot trends without getting caught up in small anomalies that get annualized into massive numbers.
Looking at just the goods side of the equation, imports and exports both seem to be growing again, with or without the petroleum numbers.
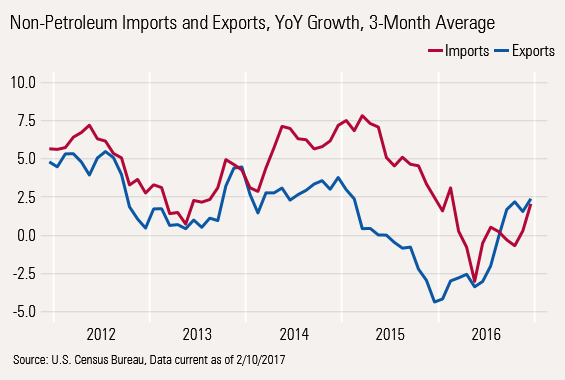
This graph shows that export growth rates bottomed in December 2015 and imports bottomed later, in May 2016. Both are now growing at a 2.5%. The export number is now in line with the average of the last 30 years, but imports are below their 3.7% long-term growth rate, mainly because U.S. consumers have been showing less interest in goods (clothing, television, and cell phones, for example) and more interest in services (vacations) and U.S. manufactured SUVs and pickups.
Trade Barriers or Even Changed Tax Policies May Not Be a Panacea for Trade Data Without any policy changes or new trade barriers we suspect that for all of 2017 net trade would likely subtract a tenth or two from GDP, about the same as 2016 and 2014. However, that is before we see exactly what Congress and the Trump administration have up their sleeves.
In addition, it seems likely that stopping imports at the border or putting on a border tax may not do much good and might even end up doing some harm. It seems quite unlikely that slowing imports would continue to be matched with exports that continue to grow at their current pace. Certainly trading partners will not sit still for new barriers/taxes and will likely put up barriers of their own.
Further, fewer imports likely mean more inflation, the bane of consumer spending. And then there is the unknown impact of a potentially stronger dollar (it keeps prices down but U.S. goods become less competitive). Unfortunately, trade is not a closed system. The interactions among the exchange rates, interest rates, inflation, and real-world trading partners can easily thwart a lot of very well-intentioned plans.
Budget Temporarily Looks a Little Better; One Ugly Issue Raising Its Head The budget deficit for the first four months of fiscal-year 2017, and especially the single month of January, were better than we expected after three months of relatively disappointing news. The year-to-date trends remain intact with slow tax collections and spending continuing to tick along at a still relatively controlled 3.5% rate.
However, the total receipts number isn't quite as bleak as the headline number might suggest. Other revenue includes a one-time payment from the Federal Reserve a year ago of $19 billion that did not recur in fiscal-year 2017. If not for that, total revenue growth would have been a more acceptable 2.2%. That is still lower than fiscal year 2016's 3.0%, though it isn't a gaping hole.

Another business day in January may have helped the collections data some, but the government isn't sure by how much.
The Big Issue Is Interest Payments Most spending data, even healthcare-related items, seem to have stabilized at levels not much different from a year ago. However, there is one exception: interest payments.
A portion of the national debt is indexed to inflation, or TIPS, and rates vary from month to month. Unlike most fixed-rate government bonds with maturities extending out 10 years or more that may take years to see higher interest payments, TIPS adjust immediately. That is why interest expense has jumped so high in fiscal-year 2017, despite just modestly higher debt and interest rates that are still generally low.
Over the next 10 years, higher Social Security and Medicare payments are likely to drive total spending much higher, even with limited increases in every other category. Social Security and Medicare (as currently structured) will keep the debt moving higher. And over the next decade, current low-rate debt obligations will need to be refinanced at higher rates.
Lower rates for longer than expected have helped keep the deficit from getting as bad as expected just a few years ago. But the lower interest rate gift will likely burn off, just as the heart of the baby boomer generation retires, causing debt levels to balloon.
Although Medicare/Social Security growth will slow dramatically by the mid 2030s, the damage of higher debt won't go away, and the interest-on-interest impact of expanding debt becomes the primary culprit for even higher debt. By CBO figures, interest expenses will move from a manageable 1.5% of GDP now to 5% in the decade beginning in 2038. In the meantime, mandatory spending (largely Social Security, Medicaid, and Medicare) will grow from 13.0% to 17.2% of GDP. Not surprisingly, that moves the debt held by the public from an already high, nonrecessionary level of 77% of GDP to a truly unsustainable 144% by 2048. That's why changes in taxation and spending must be thoughtful and targeted and combined with other methods of encouraging growth.
Job Openings Not as Bullish as Last Week's Employment Report The number of job openings was unchanged in December at 5.5 million openings even as employment growth in the report last week showed surprising growth of 227,000.
Looking back further, openings haven't really changed on a month-to-month basis and were stuck between 5.5 million and 5.8 million between January 2016 and December 2017. (Job openings are as of Dec. 31 and noted as December, and the employment report is as of mid-January and noted as January.) Even the year-over-year openings data is no longer accelerating, which is never a good omen for the overall employment report. Openings growth peaked back in 2015 and correctly predicted a generally slower employment growth rate.
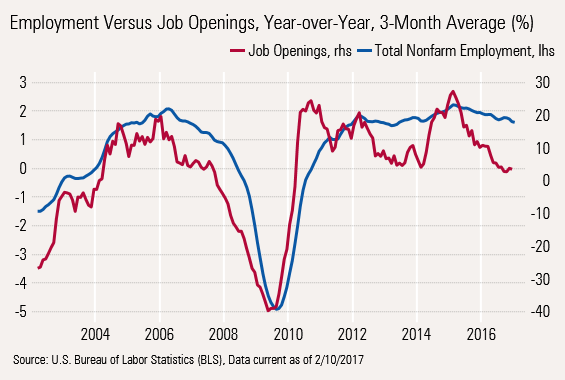
Like most recent economic data, this report and several subcomponents are creeping lower, but certainly aren't falling off a cliff and aren't a reason to panic. Still, the economy isn't showing any signs of acceleration. In fact, lethargic might be the best way to describe recent economic activity.
/cloudfront-us-east-1.images.arcpublishing.com/morningstar/T5MECJUE65CADONYJ7GARN2A3E.jpeg)
/cloudfront-us-east-1.images.arcpublishing.com/morningstar/VUWQI723Q5E43P5QRTRHGLJ7TI.png)
/d10o6nnig0wrdw.cloudfront.net/04-22-2024/t_ffc6e675543a4913a5312be02f5c571a_name_file_960x540_1600_v4_.jpg)