
A Closer Look at the Cost of Retirement: Savings, Not Returns, Are Key
We provide our full analysis of the rising cost of retirement and how to meet your retirement goals.
/s3.amazonaws.com/arc-authors/morningstar/951e122c-7299-4252-bafb-80cfefb25764.jpg)
By David Blanchett, Michael Finke, and Wade Pfau
Investors often need to make assumptions about future asset returns in order to estimate how much they may need to save today in order to meet retirement-spending goals. We generally look to the past to project the future, but higher prices for stocks and bonds today suggest that investors can likely expect lower returns. Higher-earning Americans are also living longer, increasing the cost of funding a retirement income goal. It is important to recognize the planning implications of funding a longer retirement in a low-return environment.
Using a lifecycle model in which households maximize utility by smoothing spending over time, we find that households will need to save significantly more in order to maintain their lifestyle in retirement. Even when we incorporate Social Security, taxes, and a decreasing retirement spending path, a 25-year-old worker earning $100,000 a year will need to save 40% more each year if we project returns consistent with today’s stock and bond valuations with expected increases in longevity. Higher savings rates and increasing longevity also mean lower optimal spending across a lifetime and higher costs of leaving a legacy.
Our findings imply that planning tools should strive to give planners the flexibility to incorporate lower potential returns, and that employers should consider higher default savings rates and auto-escalation in defined-contribution plans to increase participant savings rates if low returns persist.
The Double Whammy of Low Returns, Longevity Optimal lifetime saving and spending depend on future earnings, years in retirement (a combination of retirement age and longevity), and expected investment returns. Higher investment returns can allow a household to save less and earn more income in retirement. For example, assume a household earns $50,000 at age 25, expects a 3% annual growth rate in income, and wants $1 million in purchasing power after age 65. If they expect a 5% real return on investments, they will need to save 10% each year to reach their goal. However, if the return expectation drops to 2%, they will need to save 18% every year until retirement to reach the same goal. Similarly, real retirement income on that same pot would be about $50,000 a year with 5% returns or $20,000 with 2% average gains. More on retirement income in a bit.
How much lower could returns be in the future? First, when considering the implications of a low-return environment, it is important to remember that the expected portfolio returns are net of inflation and any investment expenses. Given today’s negative bond returns net of asset management fees (average 1%) and inflation (0.73% in 2015), and expected real equity returns of perhaps 2% to 4% net of asset fees, it is important to understand the planning consequences of a future with 0% to 2% real portfolio return.
People are also living longer. This is generally good news, but it does make retirement more expensive. Life expectancies for older Americans have increased considerably over the past 100 years and are projected to continue increasing. Men and women who reach age 65 in the United States are expected to live to 86 and 89, respectively, by 2100—up from 81 and 84 in 2000 and 76 and 77 in 1900, according to the Social Security Administration.
Longevity doesn't treat people equally, however. Higher-income (and higher-wealth) households are living significantly longer than lower-income (and less-wealthy) households. For example, a man in the top income percentile is expected to live three years longer than a man with a median household income, based on data from the Health Inequality Project. The same figure for wealthy women is four years.
The Changing Cost of Retirement It's not only younger savers affected by lower future returns and longer retirement periods. This environment also affects retired people and those about to retire by making annuities (or a similar bond-ladder strategy) more expensive.
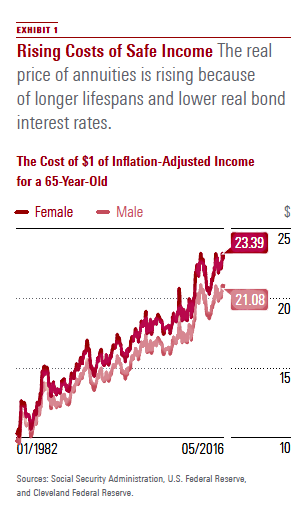
To illustrate how changes in longevity and real bond returns have increased the cost of a safe stream of income at retirement, we estimate the price of buying $1 in income via an inflation-adjusted annuity through the mortality-weighted net present value of cash flows needed to fund average lifetime income. Exhibit 1 uses historical mortality tables from the Social Security Administration, historical Treasury yields from the Federal Reserve,and historical implied inflation estimates from Cleveland Federal Reserve to calculate the cost of funding each year since 1982. True payouts offered by annuity companies will differ slightly, although this approach approximates the historical payouts for nominal annuities based on data from Immediate Annuities.
(Click image for full-sized version)
Exhibit 1 is a stark reminder that investors today should strongly consider planning for a more expensive retirement. The price of a dollar of safe income for a client retiring today is nearly 50% higher than it was for a client retiring in 2000 because of increases in longevity and declines in real bond interest rates.
While the costs of buying a dollar of real income for a lifetime have been increasing, it is important to point out that, in contrast to conventional wisdom, annuitization can become a more attractive option when interest rates are low. This is because the increase in the cost of building a bond ladder is greater than the increase in the cost of buying an income annuity in a lowrate environment. With a bond ladder, retirees spend principal and interest. With an income annuity, retirees spend principal, interest, and mortality credits, which are the subsidies from the short-lived to the long-lived. With interest low in both situations, the mortality credits tend to become more important. Meanwhile, the low discount rate for the bond ladder makes it increasingly expensive, relatively speaking, to fund spending planned for the distant future.
Saving Simulation Model We created a model to better understand the effects of lower returns and living longer on saving for retirement. Our model estimates the savings rate needed to maintain preretirement aftertax income in retirement. A more comprehensive review of this model is available in our full research paper, "Required Retirement Savings Rates Today."
Several assumptions go into the modeling process. For example, we assume retirement begins at age 65, all savings are pretax, and that the retirement income need changes in retirement consistent with one of our previous research papers (Blanchett, 2014), which found that retirees tend to decrease spending during retirement.
Earnings and savings rates are assumed to change throughout a worker’s lifetime consistent with distribution differences observed today. Earnings curves are especially important for younger workers, who are likely to experience significant increases in earnings over their working lifetimes.
Because earnings typically rise, savings are assumed to increase as well throughout the individual’s working lifetime.
The length of retirement varies depending on the year in which a household expects to retire based on projected increases in expected mortality. Mortality rates used to estimate life expectancy were also adjusted based on the household income percentile. The length of retirement was set so that there is only a 20% probability of either member of the household outliving their savings. Mortality rates for single households are based on gender-neutral mortality, while mortality rates for a married household assume one male and one female that are the same age. Expected improvements in mortality, and the differences that exist across income levels are also incorporated into the analysis.
The returns for the analysis use an autoregressive model similar to the one introduced by Blanchett, Finke, and Pfau (2013). The return models are calibrated so that one return series approximates the historical averages, and includes three additional scenarios of low, medium, and high expected returns. The high scenario has returns that are similar to the long-term averages, but incorporate today’s low bond yields. A 50-basis-point portfolio fee is also included to reflect basis costs associated with investing.
The asset allocation assumed in the model is based on the Morningstar Moderate Lifetime Index glide path. Savings levels are determined by solving for an 80% probability of success. Scenarios for low, moderate, and historical asset returns are included. The low and moderate simulations assume that, for example, bond yields begin at a 2% real rate of return and either remain low or, in the moderate scenario, rise slowly over time. In the low-bond-return simulation, for example, the mean real return is set at 2%, rises to 3.5% at the 75th percentile, 5.25% at the 95th percentile, and falls to 1% at the 5th percentile. In the moderate return example, the real return rises to 4% on average. It should be noted that today’s real bond rates on long duration corporate securities may fall below the low-return scenario, so these estimates should not be viewed as unrealistically pessimistic.
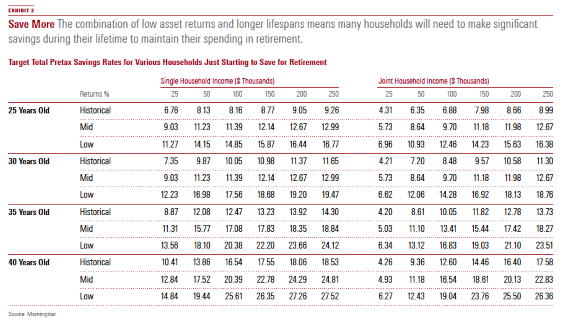
Low Returns, Long Lifespans, Save More Savings rate estimates for historical, low, and moderate ("mid") return environments are listed in exhibit 2 by age and household (single/ joint). Rates are total pretax contributions and may be met by any combination of savings from the participant or employer contribution. Age denotes when the individual or household began saving for retirement, which is assumed to begin at age 65. Note that higher longevity estimates are baked into these savings rates figures.
Optimal savings rates using historical return data for households who begin saving at age 25 are between 4.3% for low earners ($25,000) up to 9% for high earners ($250,000). Assuming more realistic returns (low returns) increases the optimal savings rate by 63% to 7% and for high earners by 82% to 16.4%. The results are even more dramatic if households wait to age 35 or 40 to begin saving for retirement. For single workers at age 35, optimal savings rates rise as high as 24.1% in a low-return simulation compared with 14.3% using historical returns. If the individual waits until age 40, the optimal savings rate rises to 27.5%. Even in a moderate return scenario, optimal savings rates are 24.8% for a high-earning single household and 22.8% for a couple.
The combination of low asset returns and living longer means many households may need to save significantly more to maintain spending in retirement. Many individuals may be unwilling to accept the lifestyle sacrifices required to save a quarter of their earnings. A reasonable alternative for many could be to delay retirement. Postponing retirement increases the number of years of savings (and asset growth), reduces years in retirement, and increases Social Security income.
A couple earning a combined $250,000 would need to save 26% of income to retire at age 60. Delaying retirement to age 70 would reduce the optimal savings rate to a much more palatable 18.7%. The benefits of deferring retirement are even greater in a low-return environment (a 7.3-point reduction for this couple) than in a historical return environment (a 4.2- point reduction).
The Savings Cure Convincing evidence shows that historically high stock and bond prices will likely lead to lower future investment returns. Similarly, the low yield on safe assets today, coupled with increases in longevity, has doubled the cost of buying guaranteed retirement income since 1980. Investors hoping to soften the blow of low safe asset returns by accepting greater portfolio risk are not likely to achieve historical returns on equity investments.
Investors facing this environment must accept the reality that they may likely need to save more to maintain their lifestyle in retirement. We have shown that a low-return environment plagues both the accumulation and decumulation phases of retirement planning, and the only apparent cure is saving more.
In accumulation, lower returns grow assets more slowly, and in decumulation, lower returns produce less income and assets are used up more quickly than historical rates would suggest. Lower returns in retirement can lead to a greater required savings level.
The steady increase in life expectancy means a longer retirement period and a need for a larger savings pot at retirement, especially for wealthier workers. Again, this requires people save more today to fund the same income after retirement. However, few people want to save more because that means spending less today. A simple and effective response to these forces is to delay retirement. Working longer can often shave several percentage points off the required savings rate.
Using historical asset return data or outdated mortality assumptions may result in unrealistically optimistic estimates of either the age of retirement or the amount of savings required to fund retirement. For example, assuming a 30-year retirement period ignores the 43% of typical annuitants today who are expected to live beyond age. When setting a retirement period, 35 or 40 years may be more appropriate for a healthy couple who retires at age 65. Rather than set returns at historical averages, bond returns should be set at today's yield curve and equity returns should be adjusted for lower expected returns.
The risk of presenting unrealistic scenarios is that clients may believe that they can achieve long-term financial goals without the sacrifices required by the current low-return environment. Using historical returns may also mask the potential benefits of strategies that provide greater value in a low-return environment, such as the ability to earn mortality credits through later-life annuitization.
/cloudfront-us-east-1.images.arcpublishing.com/morningstar/U772OYJK4ZEKTPVEYHRTV4WRVM.png)
/cloudfront-us-east-1.images.arcpublishing.com/morningstar/O26WRUD25T72CBHU6ONJ676P24.png)
/cloudfront-us-east-1.images.arcpublishing.com/morningstar/WDFTRL6URNGHXPS3HJKPTTEHHU.png)
:quality(80)/s3.amazonaws.com/arc-authors/morningstar/951e122c-7299-4252-bafb-80cfefb25764.jpg)