
Demographics Holding Back Growth
Data and earnings this week provided more signs that demographics remain a major headwind.

This week's market activity remained relatively lethargic despite a plethora of news, both good and bad. This week is the heart of earnings season, and the results so far haven't been clear cut or shown much of a pattern, with a combination of beats, misses, and changed outlooks for the year.
Barring a disaster in the back part of earnings season, the S&P 500 will have likely patched together two successive quarters of earnings growth, with a real possibility of fourth-quarter growth topping 5%. Still, there have been a lot of misses and outlook downgrades. Overall earnings-growth rates are neither breaking out in a big way nor collapsing. Instead, earnings are showing modest upticks despite individual company issues.
While earnings were prominently featured this week, the economy is still looking a bit anemic, with the fourth quarter's 1.9% GDP growth rate falling below target. However, large inventory swings and net export changes continue to distort the results. Furthermore, both existing- and new-home sales missed predictions by wide margins in the month of December, a month that is admittedly volatile and not terribly indicative of long-term trends. It does seem, though, that a combination of higher mortgage rates, sharply higher home prices, and low inventories are all weighing on the housing market, which should be benefiting from improved demographics.
The manufacturing sector, both in the U.S. and abroad, is poised to continue recuperating, with flash purchasing manager data and real-world orders both looking a bit better in this week's releases.
In general, the economic data and earnings data both support our theme of modest economic growth that very strong demographic headwinds continue to hamper. Our biggest worry remains the consumer, who has seen slightly higher wage gains but now faces sharply higher prices on many key purchases.
We don't think the economy is going to fall apart, but growth of 1.75%-2.00% seems more likely to us than the current consensus forecast of 2.4%. Yes indeed, federal government policy changes could certainly help matters, possibly by a lot if structured properly and enacted quickly. Still, policy and tax changes aren't likely to have the hoped-for impact until later in the year at best. In the meantime, current trends aren't great, with higher interest rates and more elevated inflation already beginning to take a bite out of growth rates. For now, we will stand on the sidelines with our old forecasts until policy changes become more concrete.
Underlying GDP Growth Still Modest, but not as Volatile as Quarterly Data Suggest Sequential real GDP growth in the fourth quarter was 1.9%, down from abnormally high growth of 3.5% in the third quarter but still below the consensus of 2.2% and the Atlanta Fed GDP Now forecast of 2.9%.
However, looking at GDP on a quarter-to-quarter basis and then annualizing that figure has been a very dicey proposition. Getting inventory, sales, and imports into the correct and matching quarters is always tough. Seasonal adjustments can account for average weather and events but not for big one-time storms or lasting temperature extremes. And even small changes get amplified when small quarterly changes are annualized. For instance, lowly soybean exports soared in the third quarter and collapsed in the fourth quarter, severely punishing short-term net exports and GDP growth.
The middle column in the table below shows a huge range of quarter-over-quarter results over the past year. The year-over-year data, comparing the current quarter with the same quarter a year ago, is much tamer. The good news is this data is also finally beginning to show an improving trend that may lead full-year numbers higher. However, that hasn't happened just yet.
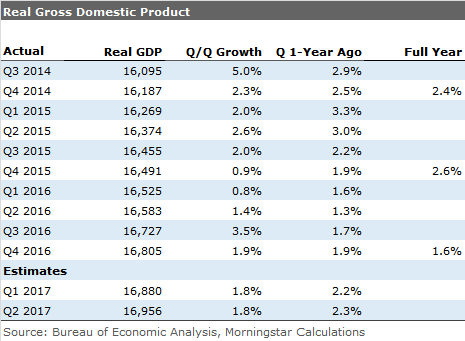
The normally least-volatile data set, a full four quarters of results, looks a bit worse, suffering from a larger-than-normal inventory swing this year. With inventories already moving modestly higher, 2017 GDP growth should normally look better than 2016, based solely on a less dramatic inventory swing. In any case, we believe current data suggests core GDP growth rates of 2% or less.
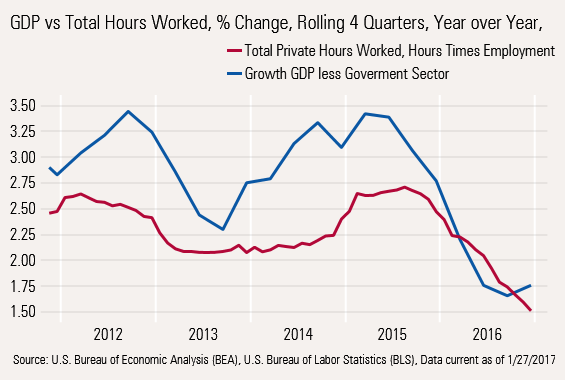
GDP Growth Is Still Slower Than Usual It's possible to make a lot of short-term excuses for the economy. From time to time we have fallen into the trap of using some of these excuses. However, the long-term rolling four-quarter growth rate for the economy is not what it used to be, even with inventory and export data aside.
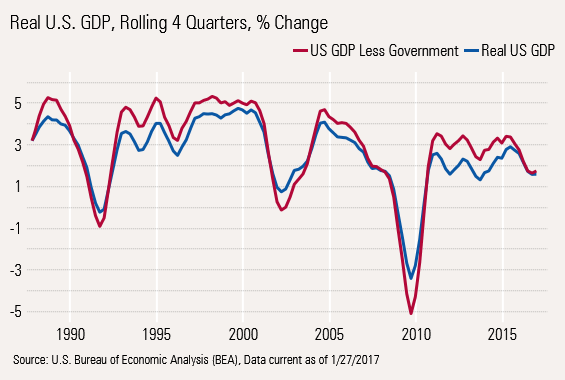
The graph above speaks for itself. Past rebounds have been sharper and the postrecovery rates look anemic this time, too, even after the worst post-World War II recession. We have drawn in GDP growth excluding government spending, which has dogged the GDP calculation during this recovery. The graph shows that excluding the declining/slow-growth government sector, GDP growth has been better but still not great. We don't want to get into the politics of whether this is a good or bad thing, but soft government spending is hurting the growth calculation.
Fourth-Quarter GDP Calculation Dominated by Inventories and Net Exports Each quarter the government calculates the contribution to overall GDP growth of the major underlying components. The segment contribution amounts to a relative weight for the category times a growth rate. Because consumption is 70% or so of GDP, it's usually a top contributor to growth even if the consumption growth rate is relatively stable and small. On the other hand, housing is a tiny 4% of GDP but can have swings of 20% change or more in each direction. A 20% move in housing, which is not unheard of, could add almost 0.8% to GDP, which is not small potatoes in a world of 2% growth. All of the individual contributions in the table below add up to the total GDP growth.
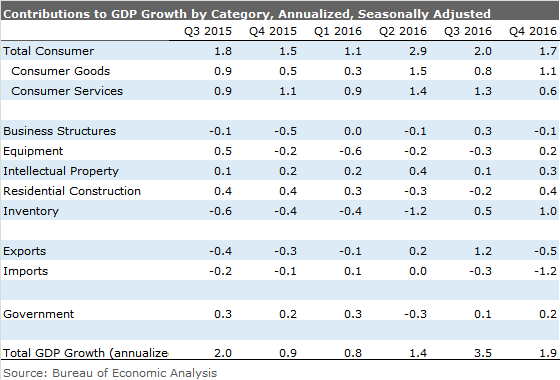
This quarterly GDP contribution table shows that consumption dominated the GDP calculation, accounting for 1.7% of GDP growth of 1.9%. The figure is a bit less than in the past, and with higher inflation (potentially offset with higher wages), we suspect the contribution will be smaller in the future.
What is noticeable in the overall table this time around is that inventories and exports had a huge impact on GDP, with inventories adding a full percent to GDP and net exports (imports and exports, combined) taking a huge 1.7% off the calculation. Even offsetting these two figures, growth would have been 0.7% higher excluding the negative impact of exports and the positive role of inventories, or a more respectable 2.6% growth rate overall.
Inventory and Export Data Less Volatile in Annual Data Sets Over longer periods of time, as little as a year, the ups and downs of inventories tend to cancel out (exports have more of a trend tendency but still show less volatility measured over longer periods). Frequently an extreme good quarter for inventories is followed by a bad one and vice versa. However, over the course of a full year, the inventory swings are seldom large, as shown below.
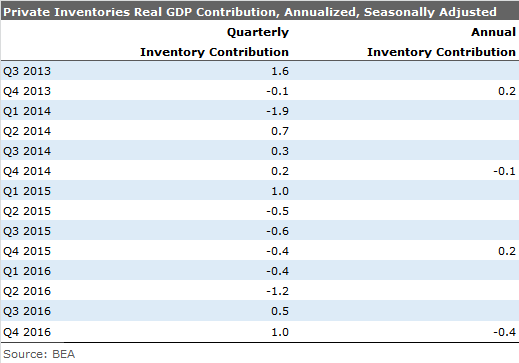
That longer-term pattern is the reason a lot of economists ignore the volatile inventory swings in the quarterly data.
Annual Data Shows Consumer Still Dominates; Businesses and Even Housing Not Much Help in 2016
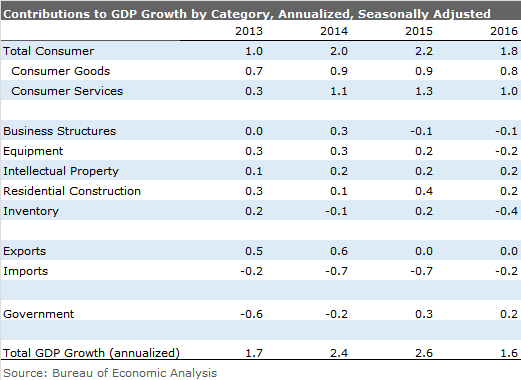
The table above is identical to the one we used earlier but shows full-year data. The consumer remains the dominate feature of the table, with the role of inventories and net exports greatly reduced. In 2016 business spending on structures, equipment, and software didn't add much of anything to growth after adding 0.8% to GDP growth as recently as 2014. On a positive note, business spending did look a bit better sequentially in the fourth quarter of 2016, suggesting an end to the capital spending drought.
Total Hours Worked and GDP Growth Have Moved Down in Tandem One exercise we do every quarter is to compare the total hours worked in the economy with the GDP growth rate. Because of productivity, GDP should generally run ahead of hours worked. That has been the case for most of the recovery. However, for most of 2016, GDP fell faster than hours, suggesting potential issues with employment and hours growth, which materialized late in 2016.
However, with GDP growth excluding government now moving up again, the worst of the employment belt tightening might be nearing an end, which would be good news for the consumer. The improvement is even more dramatic in quarter-over-quarter data (versus rolling four quarters shown below).
Housing Trends Intact, New Homes Outperforming Existing Homes; Steady Growth Data on both existing homes and new homes for December were disappointing and are consistent with last week's relatively poor housing starts and permits report.
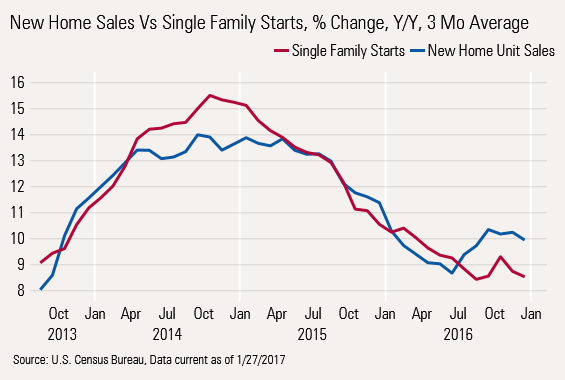
Starting with the long-term view of the more important (economically and job-wise) new home segment, growth slowed modestly in 2016 and has now stabilized. New home sales peaked at around 12% annual growth rates early in 2016 before dropping to around 9% before moving back into the double-digit range again, recently. That's a healthy number, but not enough to swing the economy wildly in either direction.
Relatively similar moves in starts and new-home sales suggest the slowing but stabilizing trend is for real. Keep in mind that starts includes more types of builders including homes built on single sites for the builders' own account or commissioned by a land owner or tract homes. New home sales include primarily tract homes.
Monthly New Home Sales Slump to 10-Month Low, not Indicative of Trends Just to prove I was paying attention this week, I am showing the volatile monthly new home sales data below.
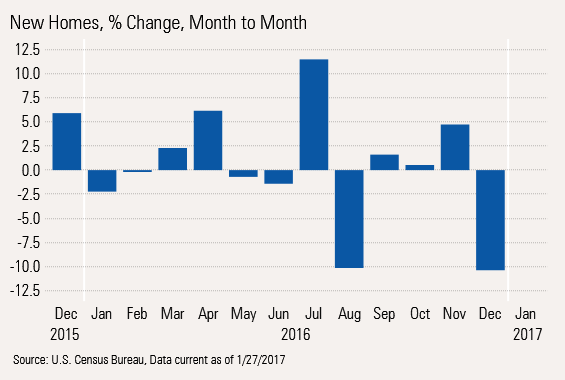
True, the graph shows big monthly drops in new home sales. Still monthly data, especially December data, is highly volatile. It is nearly impossible to discern a pattern in the monthly data, which is why we prefer to use quarterly or annual year-over-year data and not the silly monthly data that the press had a field day with earlier this week.
Higher Home Prices Continue to Pressure Buyers Before we talk about existing-home sales, we thought we would show home price data, which is now accelerating again after a brief pause. We think that price pressures, along with higher interest rates, are restraining the existing-home market.
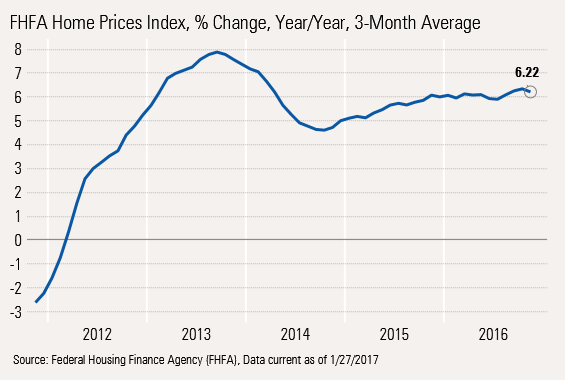
After mortgage rates plunged in 2013, the housing market began its recovery in earnest, pushing prices sharply higher, as much as 8% at one point. That, combined with higher interest rates (the Taper Tantrum) and higher prices, caused sales to again drop off. When rates dropped back and home prices increased a more manageable 4%-5%, sales again accelerated.
So if we know 4% appreciation is good and that 8% is too much, what about the current price increases of 6% or so? I don't think 6% is a problem, but 7% increases with higher mortgage rates would likely stop the housing recovery in its tracks.
We do note that price appreciation rates between geographic regions are beginning to converge, with just a handful of markets growing faster than 10%. Some formerly hot markets such as the West Coast are seeing slowing price appreciation while Texas and the Southeast and even some conventional Rust Belt cities are looking better.
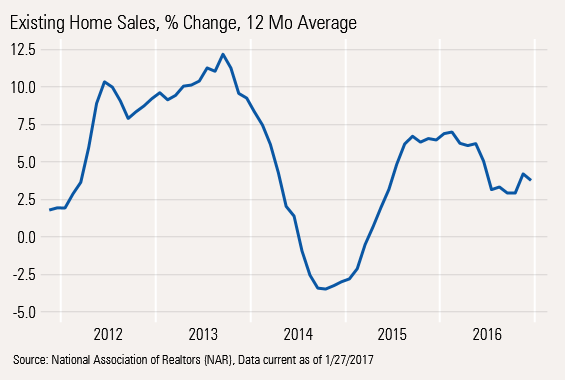
Existing-Home Sales Have a Bad Month, Too Like new home sales, existing-home sales had a bad month, likely because of the combination of much higher interest rates, low inventories, and high prices. These issues have been brewing since mid-2015 when growth rates stopped accelerating. Unlike new home sales, we don't believe this is just a single-month issue. Existing-home sales struggle to grow even 5% while new home sales are increasing at closer to a 10% rate.
Purchasing Manager Data Better Again: Is It Real This Time? The levels of purchasing manager optimism continue to improve, even in the face of the uncertainty created by Brexit and other elections around the world. While the U.S. and European data was resoundingly better, we will have to wait for next week to get the all-important Chinese data.
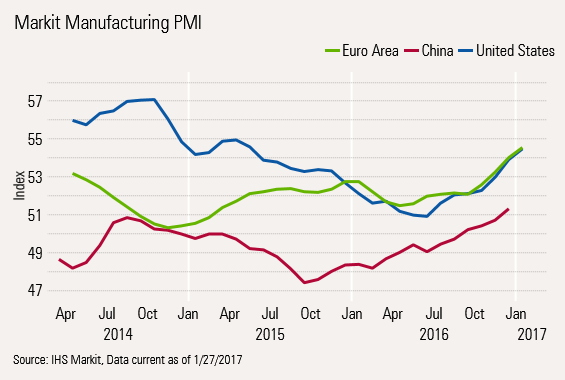
Real-World U.S. Data Continues to Inch Forward Purchasing Manager data has been looking bullish for some time with little improvement in real world shipment data or even order data. We debated whether to stop discussing PMI metrics at all anymore because they didn't seem to add much value. However, in a close reading of the fourth-quarter GDP report, equipment sales were up sequentially in the fourth quarter, a rather novel event. European industrial production numbers, though a bit dated, have been looking better, too.
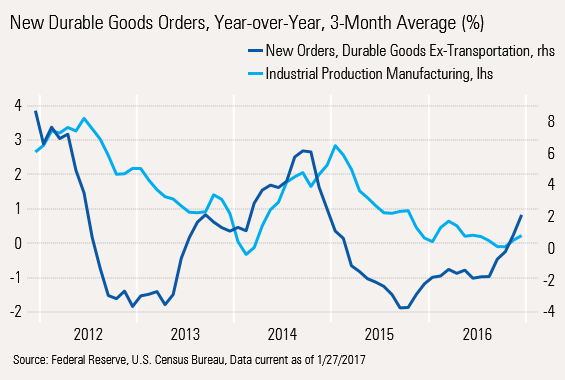
Now this week the durable goods numbers continued to pull themselves out of the gutter. New orders for durable goods (excluding transportation) have been acting better since late summer. Industrial production has taken a little longer to improve, and the movement is relatively hard to see. While not exactly surging, better orders, even at low-single-digit growth rates, are encouraging. We will need to have better business capital spending in 2017 to offset what is likely to be a slightly worse-performing consumer. Business capital and investment spending had been on its back most of 2016, so we welcome any help we can get.
/cloudfront-us-east-1.images.arcpublishing.com/morningstar/54RIEB5NTVG73FNGCTH6TGQMWU.png)
/cloudfront-us-east-1.images.arcpublishing.com/morningstar/ZYJVMA34ANHZZDT5KOPPUVFLPE.png)
/cloudfront-us-east-1.images.arcpublishing.com/morningstar/MNPB4CP64NCNLA3MTELE3ISLRY.jpg)