
Job Growth Trend Isn't Pretty
A slow economic environment and industry-specific factors are driving private employment growth lower year over year.

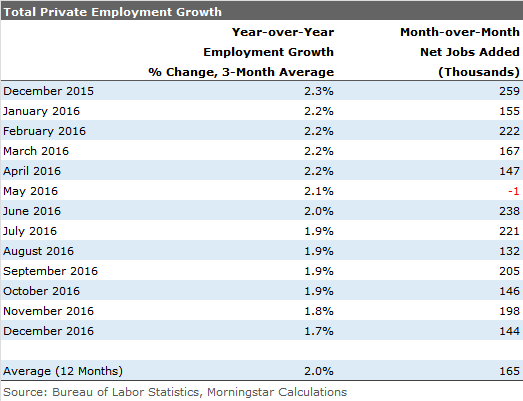
The employment report was a disappointment to some, with private-sector employment growth of just 144,000 versus expectations of 175,000. This compares with a revised 198,000 jobs added in November and a whopping 259,000 last December.
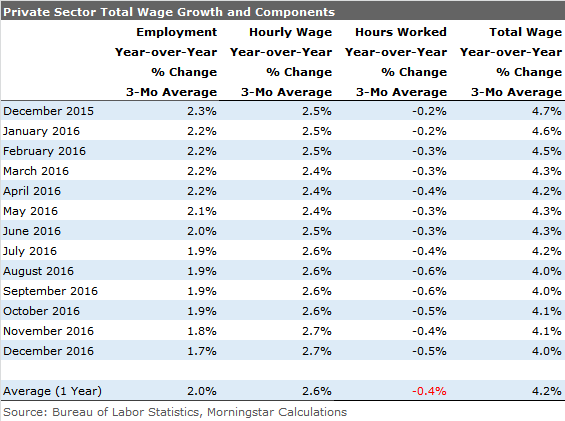
However, we don't take a lot of stock in the month-to-month numbers, which are volatile and difficult to seasonally adjust properly. Check out the volatility in the last column of the table below. That represents a range of negative 1 to a positive 259,000 in a 13-month period. We don't believe for a minute that the underlying economy was that volatile.
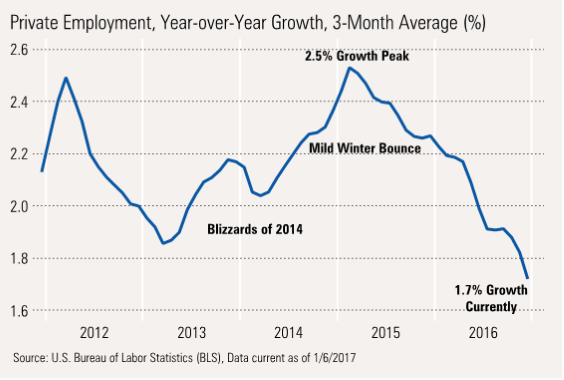
Using our year-over-year, three-month averaging procedure, it's much easier to see the trend, and it isn't pretty, with private-sector employment growth dropping from 2.3% to 1.7%.
Both Macro and Industry-Specific Issues Are Driving Slower Growth We believe the slowing results are from a slower economic environment as well as industry-specific issues. Healthcare hiring has slowed the sprint of new hires resulting from extended insurance coverage under the Affordable Care Act. Construction faced issues with slowing apartment building growth.
Retail pressures have continued to mount for brick-and-mortar stores, with many retailers, including
Taking a Look at the Full Recovery, the Results Are Even More Disappointing It's interesting to us that everyone was complaining about how slow employment growth was at the beginning of the recovery when private-sector jobs were running at greater than 2% growth in 2012. Now growth has dropped below that level, and everyone seems relatively pleased.
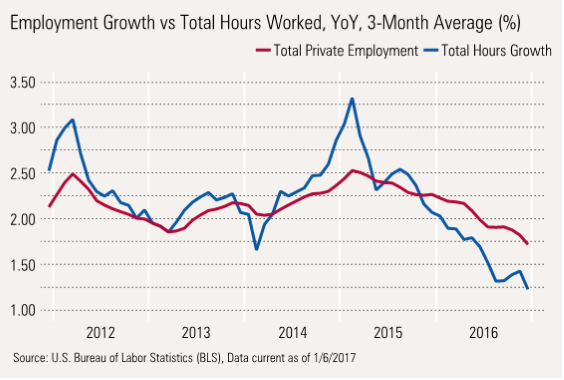
Hours Worked Have Fallen Even More Dramatically One part of the job report that doesn't get a lot of attention is the average number of hours worked. To the naked eye, the number rarely seems to move much, teetering around 33.5 hours. What people fail to realize is that trend has been solidly down recently and has fallen from 33.5 to 33.3. That may not seem meaningful, but that is 0.6%, which is a lot when job growth is a meager 1.7%.
Multiplying the average hours worked by employment levels gives us total hours worked in the economy, which probably makes a lot more sense than just looking at employment levels. The red line below represents just employment growth, and is the same line as in the previous graph, though the scale is different. Growth in total hours worked presents an even more dramatic picture, as shown in the blue line below.
Total Hours Tend to Track GDP, With a Small Lag The exact relationship between hours worked and GDP growth is always a bit of a chicken-or-egg question. On some level, employment drives GDP, but without some economic growth, who will hire new workers?
The graph below demonstrates that the two are very closely related, but indeed it is GDP growth that generally leads the way. That makes sense; employers making anticipatory hires is quite rare. Instead, they tend to make do with current employees for as long as they can. And despite popular lore, they are reluctant to quickly lay off employees at the beginning of a recession. In fact, hours worked per employee will tend to lead changes in employment levels, which is one reason we remain concerned about the drop in hours worked.
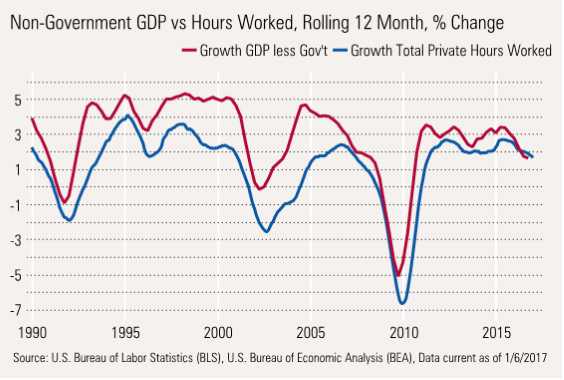
Also clear from the graph is that even in good times there is generally a healthy gap between total hours worked and GDP growth. That represents worker productivity. That gap was unusually wide between 1995 and 2000. Although the gap is also apparent since 2010, it is visibly smaller.
A Shorter-Term Graph Shows a Broken Relationship That Is Slowly Mending However, this recovery has been a bit different with a much narrower gap between total hours and GDP growth, perhaps as a result of a more service- and healthcare-oriented economy where productivity is harder to achieve. In 2016, hours growth exceeded GDP growth, which portended the current hours and employment slowdown that seems to have taken so many by surprise.
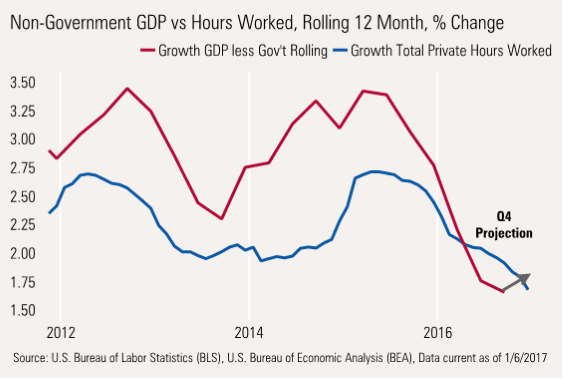
The good news is that rolling 12-month GDP growth is beginning to turn up slightly, likely preventing an employment disaster. GDP growth of 1.8% or so (our current 2017 forecast) suggests employment growth of 1.5% or maybe a little less. That translates into monthly job growth of about 175,000.
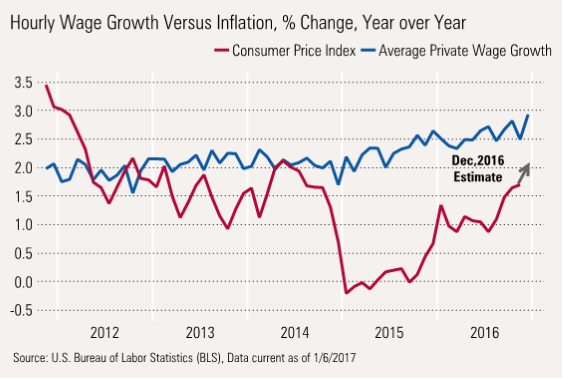
Hourly Pay Rates Move higher, but Not as Fast as Inflation One bright spot, at least for consumers, was that year-over-year wage growth jumped to 2.9% on a single-month basis, the highest level of the recovery. Some of that increase, which so many are talking about, is probably more of a change in the mix of jobs than accelerating pay rates for any given job. Low-paying retail and leisure workers have seen slower job growth, while high-paying manufacturing had a nice jump in December. Still, it's hard not to see a higher trend.
The bad news is that inflation is running much higher than it was a year ago, meaning that wage increases aren't going nearly as far.
Rolling the Total Wage Factors Together, Nominal Wage Growth Slows Some Combining all of the factors that drive total economywide wages shows that wage growth has slowed from 4.7% to 4.0% over the past year, seemingly little reason for panic.
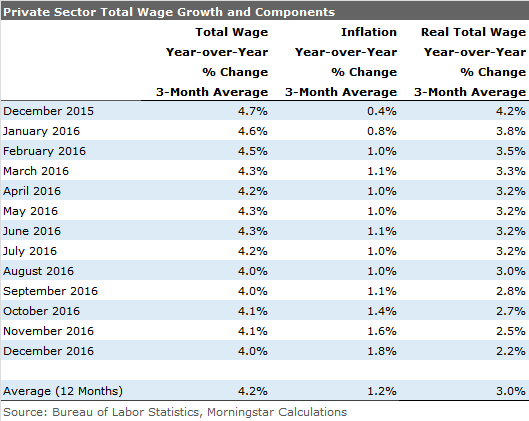
But Real Total Wages Fall Off a Cliff Still, when adjusted for inflation, the impact is dramatic, as shown below. Real wage growth has been cut almost in half, from 4.2% to 2.2%, which is why we are so concerned about the economy.
Auto Sector Receives Temporary Reprieve as December Results Surprise to the Upside The auto sector provided a welcome bit of good news, as December sales came in well above expectations at 18.4 million units. That also represents a new recovery high. That will indeed help the fourth-quarter GDP calculation. We note that with incentives sharply higher (up as much as 20% from a year ago), a good sales number is not a big surprise.
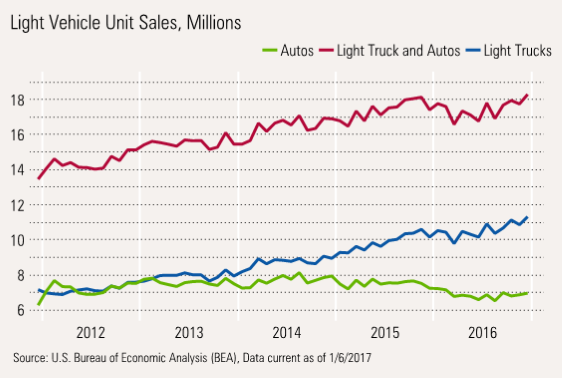
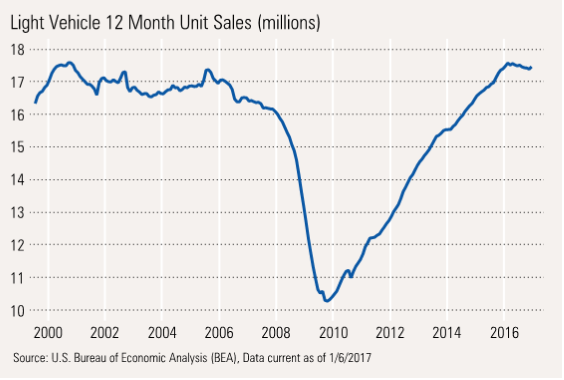
Taking a Longer View, Unit Volumes Have Likely Peaked However, even with those incentives, a longer view shows that sales are likely peaking. With smaller population growth and longer-lasting cars, it will prove unusually difficult to break out of past highs.
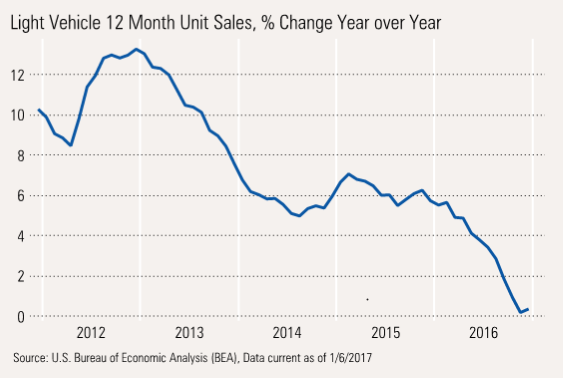
And Rolling 12-Month Vehicle Growth Rates Have Dropped to Zero This is reflected in auto growth rates that have already dropped to nearly zero, despite a great December.
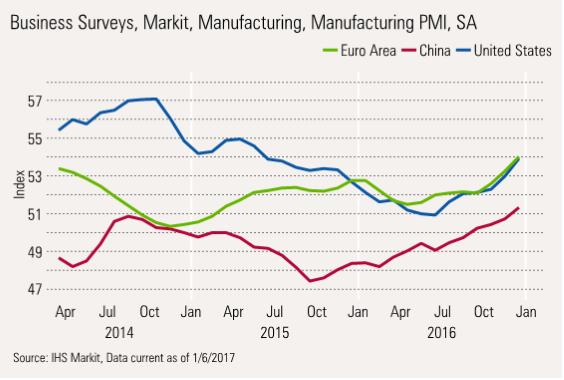
Despite Slowing in the Key Auto Sector, Manufacturers Seem Happier
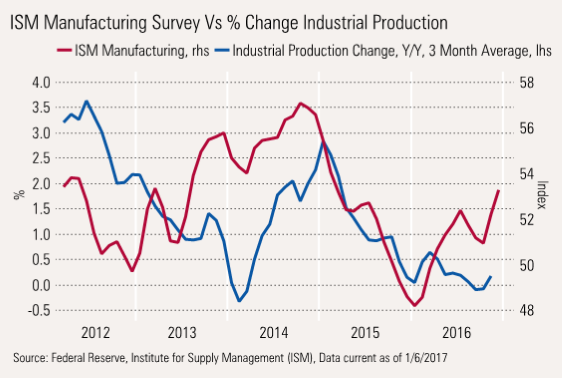
World PMI Data Is Looking Better, Too
/cloudfront-us-east-1.images.arcpublishing.com/morningstar/T5MECJUE65CADONYJ7GARN2A3E.jpeg)
/cloudfront-us-east-1.images.arcpublishing.com/morningstar/VUWQI723Q5E43P5QRTRHGLJ7TI.png)
/d10o6nnig0wrdw.cloudfront.net/04-22-2024/t_ffc6e675543a4913a5312be02f5c571a_name_file_960x540_1600_v4_.jpg)