
Bond Fund Duration May Overstate Rate Sensitivity
Over the last year, we found that bond funds were less sensitive to rates than their reported durations would suggest.
/s3.amazonaws.com/arc-authors/morningstar/fadee740-dfeb-494d-95b1-c462d0ac1f59.jpg)
In November, my colleague Eric Jacobson published a Fund Spy article entitled "Bond Duration: An Art, Not a Science." In it, Jacobson listed the imperfections of duration as the predictor of how a given fund will behave when rates change. We wanted to follow up on that idea by doing an empirical study of how well fund durations predicted a portfolio's actual behavior when bond yields change.
Concerns about rate hikes have acquired new relevance in recent months. Interest rates were already on the rise in the third quarter but that trend accelerated since Donald Trump was elected president: The yield on the 10-year Treasury note went up by 60 basis points in the weeks following the election and the Fed raised the target Fed funds rate at its December 14 meeting. Some bond managers and commentators opine that a bear market in bonds is coming, and investors are understandably concerned.
For those who worry, the message from our analysis is: Worry indeed, but not as much perhaps as your fund’s duration would let you think you should. The last sentence shouldn’t be taken to mean that we are taking a position on the future course of interest rates. Rather, it should be taken conditionally. If rates do go up, most bond categories will likely lose money. They are just likely to lose less than their duration numbers would suggest.
Let’s get some technical background out of the way first. Duration measures the sensitivity of a bond’s price to changes in interest rates. The technical assumption behind the calculation is that all rates experience a parallel shift, which means that rates along the whole maturity spectrum move by the same amount.
This pretty much never happens, but that doesn’t render the calculation meaningless: We are dealing with a model, which is always an approximation to reality, and rates farther out on the yield curve—they matter most to long bonds—are strongly correlated. Optionality imbedded in some bonds adds another complication. For a callable bond or a bond backed by a mortgage pool the very cash flow generated by the bond may change depending on the behavior of interest rates. A drop in yields will, for example, make it more likely for a municipal bond to be called, thus chopping off years or perhaps decades of cash flows the bond would otherwise generate.
The industry has come up with an option-adjusted duration to take this difficulty into account. For our purposes, what matters is that funds and fund companies do their best to calculate the durations on each of their holdings. It is, after all, in their best interest to know how their holdings will behave. They do this either through home-built or commercially available analytics. After all the bonds’ durations have been calculated, they aggregate these numbers to come up with a weighted average duration for the fund as a whole. Morningstar surveys for this information, and for most funds it gets those numbers, usually with quarterly frequency. For our study, which covered about a year (52 weeks, to be precise), we used an average of all the durations provided by each fund during that period. Most funds don’t change their durations dramatically over a period of one year (though exceptions do occur).
Now that we know what we are going to assess—fund-provided durations, which in what follows we will call reported durations—we need to explain how we calculate what we call empirical durations. Empirical duration is a measure of how a given fund actually reacted to changes in yields.
We do this using a standard technique of linear regression. For each fund, its weekly returns are regressed on the changes in yields during this week. For yields we use the yield on 10- and five-year Treasury notes; we thus run two separate regressions for each fund. (This is our attempt to address to some extent the issue of parallel shift in rates we mentioned in the previous paragraph.) Since we have 52 weeks of observations, this gives us a pretty reliable statistic. The period we selected ran from early December 2015 through early December 2016. Overall levels of interest rates didn't change much over that span. Rates on the 10-year Treasury note were in the 2.20% range in December 2015 and around 2.40% a year later. Thus, there was no marked shift in the level of rates over that time, even though there was a lot of movement within it; 10-year Treasury rates went down below 1.40% in July 2016. We mention this to allay concerns that the our results may have been vitiated somehow by a big directional move in interest rates.
Now, no one would expect the empirical durations to match up perfectly with reported durations. Reported durations are, as mentioned above, just a model. The question, rather, is how good a model they are. Ideally, one would expect some funds’ reported durations to overstate the sensitivity to rates, some to understate them. If one plotted reported duration on the horizontal line and empirical duration on the vertical line, one would expect the empirical durations to hug the line that equalizes them, with some above and some below. What we would expect is something like the chart below, where each point represents the reported duration (the horizontal axis) and empirical duration (the vertical axis) and the red line represents the situation where reported duration = empirical duration.
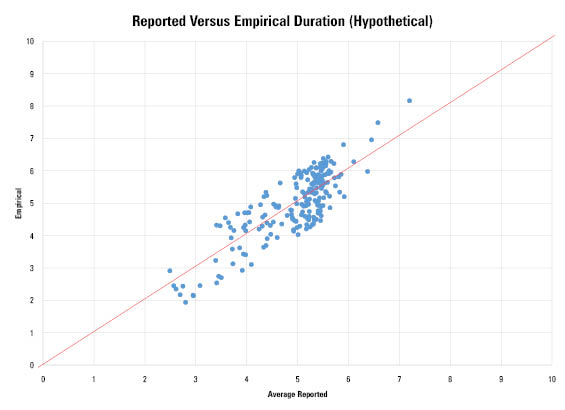
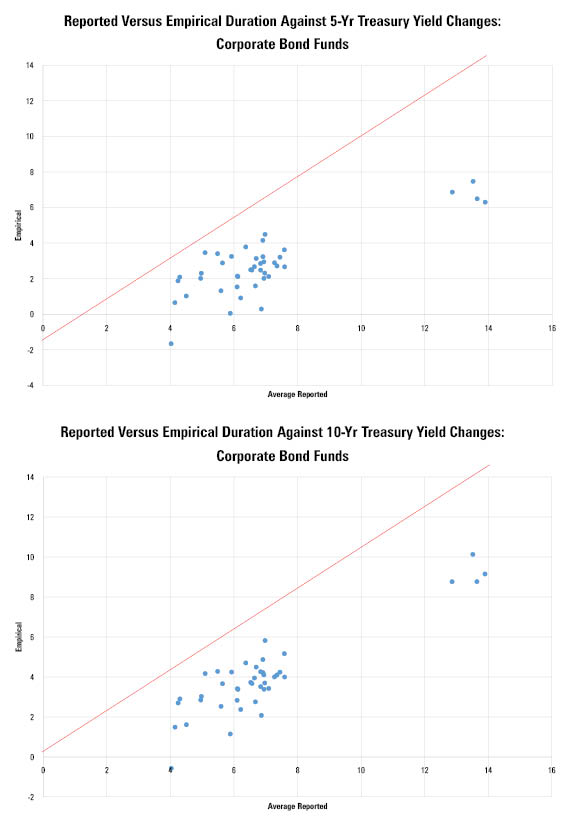
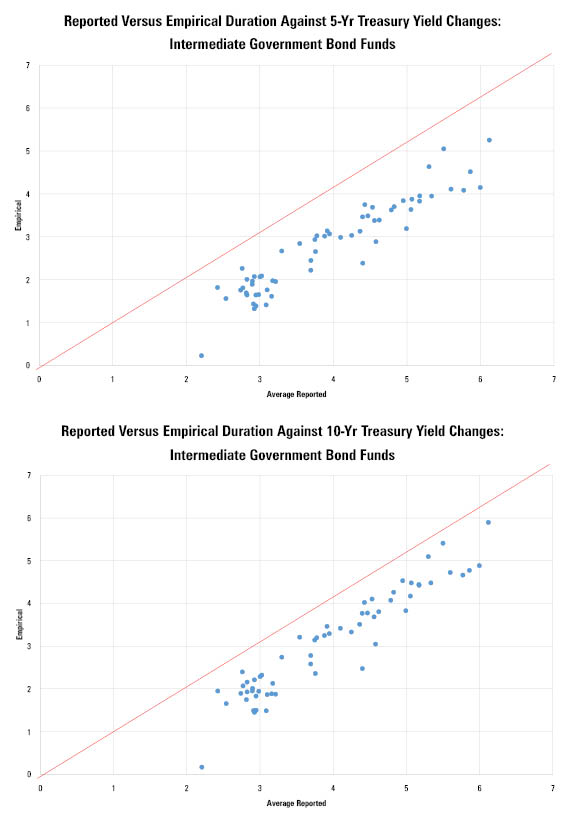
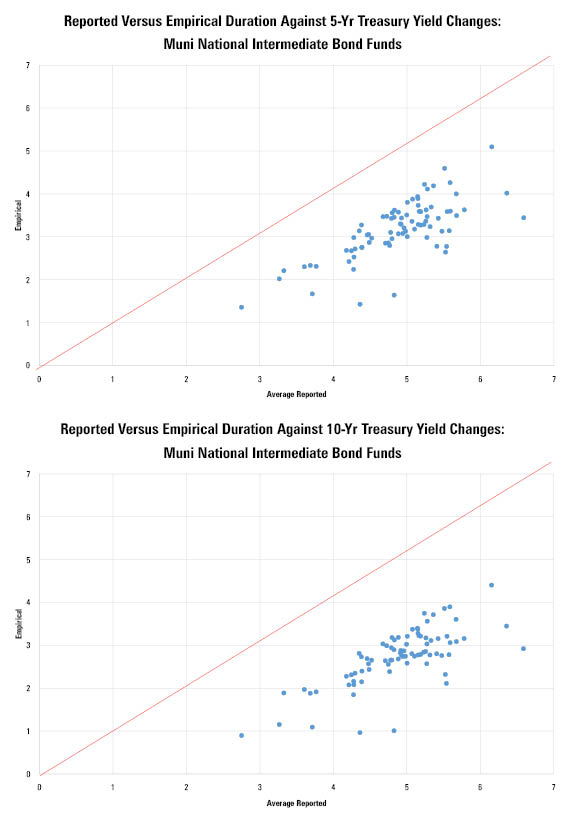
That's not what we find, however. We ran our analysis on several large fixed income categories. The results for intermediate-term bond funds are shown below, while other fund categories are available in the appendix. Each category's funds' empirical durations are calculated against changes in 10- and five-year Treasury yield changes.
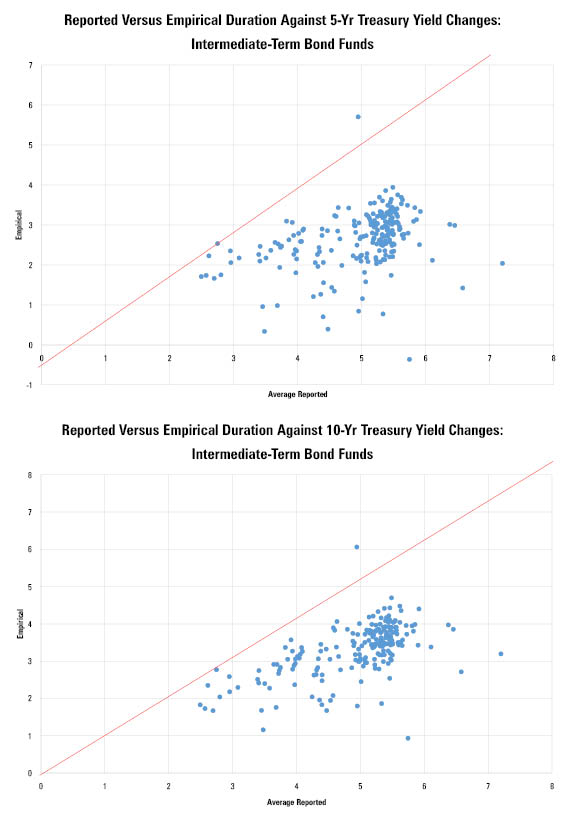
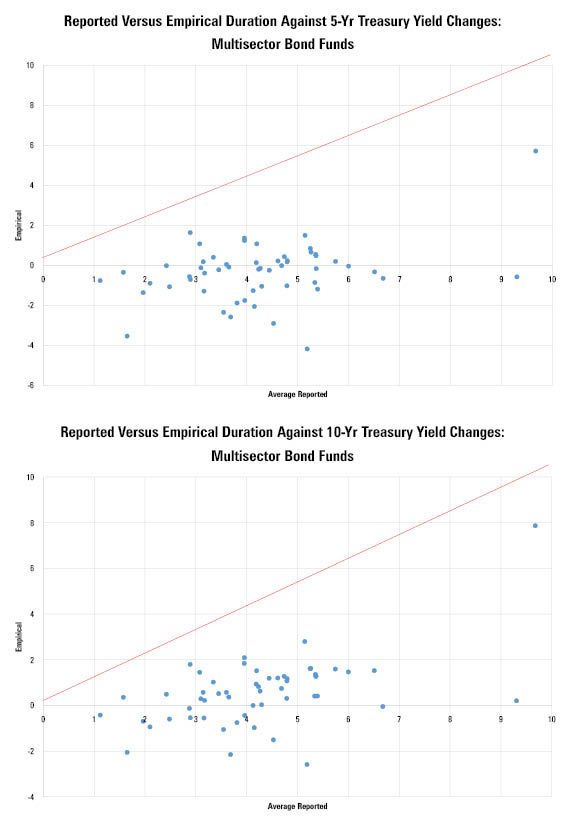
What we see is that, by and large, all funds’ empirical durations plot below the red line. Which means that for almost all funds in the sample their reported duration OVERSTATED their real-life sensitivity to interest rates. The underlying reasons for that could be the subject of further investigation. For intermediate-term bond funds, the most asset-rich category, reported duration overstated its empirical duration (measured against 10-year Treasury note yield changes) by about 1.6 years on average. For intermediate-government funds—which often carry substantial allocations to Treasuries—the distance was the smallest and averaged 0.87 years. Among the categories shown, multisector bond funds showed the biggest difference between reported and empirical duration with a whopping 3.6 years' average difference.
Finally, the results are not unique to the funds we considered, nor the time period. We ran the same analysis on the Bloomberg Barclays US Aggregate Index for the five-year period ended in early December 2016. The empirical duration of the index against changes in 10-year yields came out at 4.01 years. The index’s reported duration has been around 5.5 years for most of that period.
The takeaways for investors are twofold. First, the models the industry uses tend to overstate duration in a seemingly systematic way. It is not entirely clear why that is, although many managers acknowledge that the further you get away from the high-quality and super-liquid Treasury market, the less useful standard duration measures are. It also appears that credit exposure is one of the main culprits: Almost all high-yield bond funds show negative empirical durations over the period, which makes their reported duration essentially meaningless. The scenario in which funds’ durations became a better predictor of actual price changes would be one in which the correlations between Treasury yields and credit spreads increased dramatically. But, on the basis of most recent experience, one would be justified in concluding that if rates do indeed go up, you will likely lose slightly less money than you thought you would if you took the funds’ reported duration at face value.
Appendix
:quality(80)/cloudfront-us-east-1.images.arcpublishing.com/morningstar/OMVK3XQEVFDRHGPHSQPIBDENQE.jpg)
:quality(80)/cloudfront-us-east-1.images.arcpublishing.com/morningstar/WJS7WXEWB5GVXMAD4CEAM5FE4A.png)