
Don't Try to Time Factor Strategies
It may be tempting to time factor strategies, but sticking with a fixed plan is probably a better course of action.
/s3.amazonaws.com/arc-authors/morningstar/56fe790f-bc99-4dfe-ac84-e187d7f817af.jpg)
This article was published in the October issue of Morningstar ETFInvestor. Download a complimentary copy of ETFInvestor by visiting the website.
Investors love to chase performance. But as Morningstar and others have documented, a strong long-term record alone is not predictive of future performance. Many investors have discovered this the hard way, which has helped fuel the growing adoption of index strategies, including strategic-beta funds. These attempt to provide lower-cost, more transparent, and more-consistent exposure to securities with characteristics that have historically been associated with superior performance. But what if the apparent performance edge is not sustainable and investors are just relapsing into counterproductive performance-chasing? These are the provocative questions Rob Arnott and his Research Affiliates colleagues pose in a pair of recent articles, “How Can ‘Smart Beta’ Go Horribly Wrong?” (1) and “To Win with ‘Smart Beta’ Ask if the Price is Right.” (2)
In these research pieces, Arnott and his co-authors argue that when a factor outperforms and investors get more excited about it, it tends to get more expensive. As a result, it is less likely to outperform going forward. The same process works in reverse as factors underperform. In other words, valuations matter, and it is necessary to account for the valuations of each factor to properly set expectations for its future returns. Arnott and his colleagues went one step further and made the bold assertion that much of the return premiums during the past 50 years to the low beta and gross profitability factors were attributable to rising valuations, which are unlikely to persist. (However, they still delivered better risk-adjusted performance, net of valuation changes.)
Using data from 1967 through March 2016, the Research Affiliates team found that as value stocks become cheaper relative to growth stocks, they were more likely to outperform during the next five years. It uncovered a similar inverse relationship between valuations and future performance for the small-cap, illiquidity, investment, and gross profitability factors. This inverse relationship for momentum was weaker in the long term than in the short term. This isn’t surprising because momentum is a high-turnover strategy and its future portfolio often bears little resemblance to its present one.
The group found no significant link between the valuation and future performance of the low-beta factor. They contend that this is because the low-beta stocks’ valuations have become stretched relative to history and that they have yet to revert to the mean, a possibility they cite as a key risk. The authors also caution that, as of March 2016, valuations for a few other factors looked rich relative to history. These included high dividend yield, gross profitability, investment, and momentum. Value is the only factor that looked particularly cheap.
While valuations matter (at least for low-turnover portfolios), investors probably shouldn’t use valuation spreads to time factor exposures, unless those spreads are extreme. There is a lot of noise in the relationship between factor valuations and future performance, and it can be skewed by extreme events, like the technology bubble. And as AQR’s Cliff Asness points out in his article, “The Siren Song of Factor Timing,” (3) the success of timing factors with valuation signals is positively correlated with the value factor itself. (Arnott argues that this effect cannot fully explain the success of contrarian timing.) Asness suggests—and I would agree—that factor timers sacrifice diversification by concentrating their bets more heavily in the cheapest styles, which could increase the volatility of the portfolio.
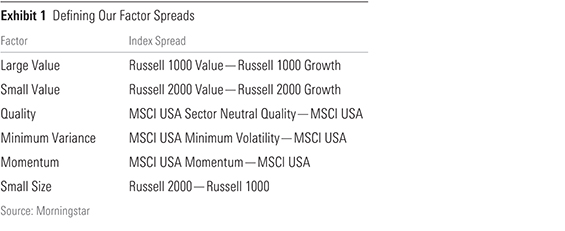
Factor Index Analysis In order to shed further light on the relationship between factor valuations and future performance, I ran a similar analysis to the one Research Affiliates conducted with several factor indexes that investors have access to via exchange-traded funds. I used the performance and valuation spreads between the indexes listed in Exhibit 1 for this analysis.
First, I looked at the ratio of the long (first) index’s valuation relative to the short (second) index and tracked the performance spread between the two indexes during the subsequent five years, similar to Research Affiliates. For each factor, I regressed the rolling five-year performance spreads against the valuation ratios at the start of each period. The results are presented in Exhibit 2. I ran this analysis once with price/book and again with price/earnings.
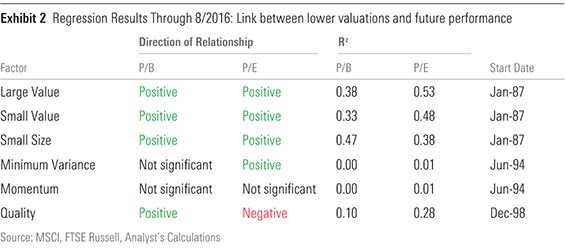
As expected and consistent with Research Affiliates’ findings, as small-cap and value stocks became cheaper relative to their large-cap and growth counterparts, they tended to do better during the next five years. But the strength of this relationship is only moderate. The R-squared values of these regressions indicate the percentage of the dispersion in subsequent five-year returns that the initial valuations explain. These values range from 0.33 for the price/book ratio in the case of small-value to 0.53 for price/earnings in the case of large-value. This indicates that the beginning-of-period valuations explain 33%–53% of the return dispersion during the following five years. That means there is a lot more going on that this simple model doesn’t capture. It is also important to note that the strength of this relationship was largely influenced by the tech bubble.
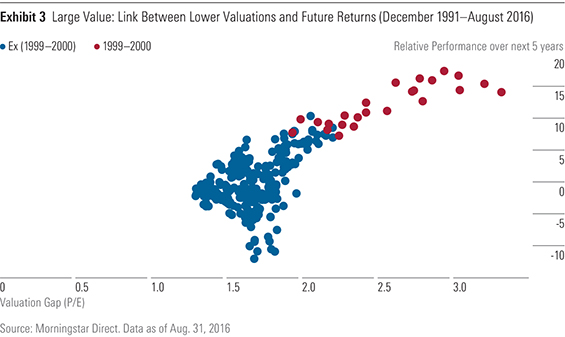
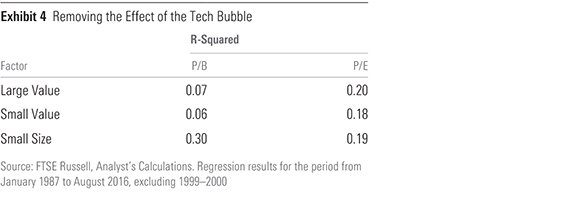
The scatterplot below illustrates this point for the large-value factor. The X-axis shows the ratio of the valuation multiple of the Russell 1000 Growth Index to the Russell 1000 Value Index. The Y-axis shows the performance differential between the value index and the growth index during the ensuing five-year period. The positive relationship between relative valuations and performance is evident. But the strength of this relationship diminishes significantly after excluding the rolling five-year periods beginning in 1999 through 2000. These are highlighted in red in Exhibit 3. Excluding these periods, the explanatory power of the value and small size factor regressions falls considerably, as shown in Exhibit 4.
I also found there was no significant relationship between price/book valuation spreads and the subsequent performance of the minimum variance index, consistent with Research Affiliates’ findings. And while there was a positive relationship between the index’s price/earnings valuation discount to the market’s and its subsequent performance, it was weak, as the regression’s low R-squared value indicates. Similarly, I didn’t find a significant relationship between valuations and long-term performance for the momentum index, likely because of its high turnover.
The results for the quality index were mixed. It exhibited the expected positive relationship between its price/book valuation discount and future performance (though this relationship was weak). But surprisingly, it tended to underperform as it became cheaper relative to the market on price/earnings. This could be a fluke resulting from the fairly short 18-year sample period. Yet it demonstrates that mean-reversion can take a long time, which could make a contrarian factor-timing strategy difficult for many investors to stick with.
Factor Timing Given the scraps of evidence I've uncovered here demonstrating that some factors tend to do better as they become cheaper relative to their history, a disciplined contrarian factor-timing strategy would seem to have the potential to be profitable. Arnott and his colleagues emphatically argue that is in fact the case in their article, "Timing 'Smart Beta' Strategies? Of Course! Buy Low, Sell High!" (4) The authors set up a strategy that targets the three factor portfolios (out of eight) that were trading at the lowest valuations relative to their historical norm up until that point. They also ran a separate returns based strategy that held the three factor portfolios with the worst average performance during the past one-, three-, five-, and 10-year periods. They found that both contrarian strategies earned higher returns than a simple equal-weighted average of all the factor portfolios, running the simulations from 1977 through August 2016.
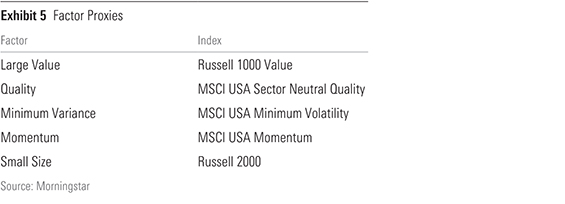
To check the robustness of this analysis, I ran a similar contrarian strategy with the factor indexes from my previous analysis, listed in Exhibit 5. I excluded the Russell 2000 Value Index because of its overlap with the Russell 2000 Index. This simulation tracked the performance of the three indexes with the worst returns during the previous five years and held them for a year before refreshing the portfolio. This contrarian strategy beat the equal-weighted factor portfolio by 1.1 percentage points annualized from November 2003 through November 2015, consistent with Research Affiliates’ findings. I did not have enough data to adequately test the valuation strategy.
Momentum is also a decent candidate to test as an input for timing factor exposures. In their work, the Research Affiliates authors found that chasing factor performance detracted from returns. My own findings were consistent with their conclusion. I ran a simulated strategy that targeted three of the five indexes with the best returns during the past year, refreshed monthly. From November 1999 through August 2016, this strategy trailed the equal-weighted factor portfolio by 33 basis points annually.
Despite the apparent profitability of the contrarian factor-timing strategy, investors would probably be better off sticking with a set factor allocation. The return benefits of factor-timing in a long-only context will likely be modest at best (before transaction costs), and it doesn’t always pay off. The relationship between factor valuations and subsequent performance is weak to moderate and is influenced by extreme events. Investors often have to wait a long time before valuations mean-revert, which can make it challenging to adhere to such a contrarian approach. Finally, factor timing leads to more-concentrated portfolios that can increase risk.
References 1 Arnott, R., Beck, N., Kalesnik, V., & West, J. 2016. "How Can 'Smart Beta' Go Horribly Wrong?" Research Affiliates.
2 Arnott, R., Beck, N., & Kalesnik, V. 2016. "To Win with 'Smart Beta' Ask if the Price Is Right." Research Affiliates.
3 Asness, C. 2016. "The Siren Song of Factor Timing aka 'Smart Beta Timing' aka 'Style Timing'." J. Portfolio Management. Special Issue 2016.
4 Arnott, R., Beck, N., & Kalesnik, V. 2016. "Timing 'Smart Beta' Strategies? Of Course! Buy Low, Sell High!" Research Affiliates.

Disclosure: Morningstar, Inc. licenses indexes to financial institutions as the tracking indexes for investable products, such as exchange-traded funds, sponsored by the financial institution. The license fee for such use is paid by the sponsoring financial institution based mainly on the total assets of the investable product. Please click here for a list of investable products that track or have tracked a Morningstar index. Neither Morningstar, Inc. nor its investment management division markets, sells, or makes any representations regarding the advisability of investing in any investable product that tracks a Morningstar index.
/d10o6nnig0wrdw.cloudfront.net/04-18-2024/t_34ccafe52c7c46979f1073e515ef92d4_name_file_960x540_1600_v4_.jpg)
/d10o6nnig0wrdw.cloudfront.net/04-09-2024/t_e87d9a06e6904d6f97765a0784117913_name_file_960x540_1600_v4_.jpg)
/cloudfront-us-east-1.images.arcpublishing.com/morningstar/T2LGZCEHBZBJJPPKHO7Y4EEKSM.png)
:quality(80)/s3.amazonaws.com/arc-authors/morningstar/56fe790f-bc99-4dfe-ac84-e187d7f817af.jpg)