
Winning Funds Often Look Like Losers
Winning funds often look more like Jay Cutler than Tom Brady.
/s3.amazonaws.com/arc-authors/morningstar/550ce300-3ec1-4055-a24a-ba3a0b7abbdf.png)
Investors tend to have some pretty ingrained misconceptions of what "winning" funds look like. For instance, winning funds lay waste to the index and category peers; they do so over the short term and long term; they corner really well, deftly avoiding big drawdowns and rocking during rallies; they don't rattle around much; they succeed like clockwork. They're Tom Brady.
For those who follow markets enough to be familiar with randomness and the resultant unpredictability of short- and even intermediate-term performance, we know this is nuts. Winning funds do not succeed anywhere near linearly. Performance is jagged; success and failure arrive abruptly; it often takes years to grind out an advantage; and so forth. This is pure torture for many investors, who bail. (This is a pattern that reveals itself in the form of hideous dollar-weighted returns; if there's any consistency in markets, it is misbehavior of this sort, but I digress).
Study However, this concept is often too abstract, so I thought I'd try to semi-simply illustrate it through an example. Here's what I did:
- Compiled a list of all unique diversified U.S. open-end equity mutual funds (that is, the nine Morningstar Style Box categories; active and index funds; no exchange-traded funds; oldest share class only). There were about 680 unique funds.
- Calculated the 20-year annual excess returns of each fund as of Oct. 31, 2016. (Excess return=fund's total net return minus return of benchmark index assigned to the category that fund was assigned to as of October 2016.)
- Sorted the funds into deciles by excess returns. (Top decile=funds with highest excess returns; bottom decile=funds with lowest excess returns.) There were around 68 funds in each decile grouping.
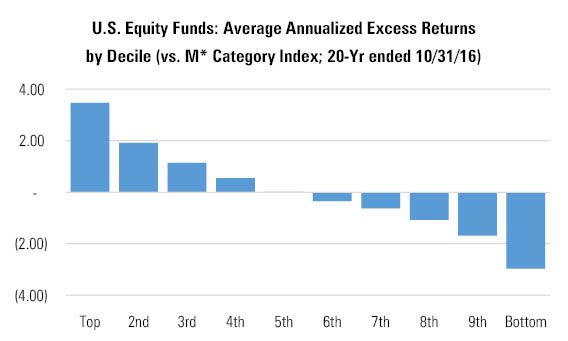
Findings When you chart the deciles by excess return, you get the expected stair-step pattern:
- source: Morningstar Analysts
The left-hand side of the above chart is Tom Brady. This is what investors idealize and, too often, expect. But reality is Jay Cutler--maddeningly inconsistent, disappointing, only occasionally thrilling.
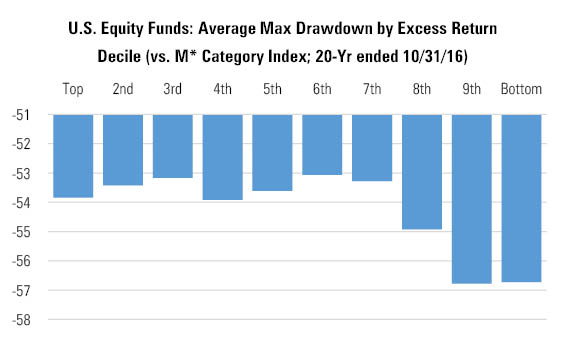
To illustrate, here are the average maximum drawdowns of those same decile groupings over the 20-year period I examined:
- source: Morningstar Analysts
As you can see, the best-performing funds did indeed have smaller drawdowns than the worst-performing. But it was hardly bloodless--the top-decile, Tom Brady-est funds of the bunch got more than cut in half at some point, on average.
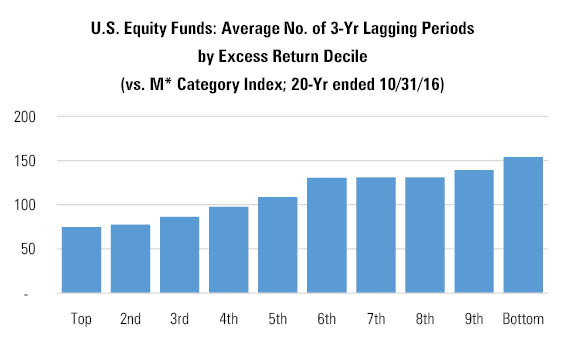
Now you might think, "OK, this is the cost of investing in the equity market, but I bet the winners lag a whole lot less than the losers." And you'd be right! As shown below, the more successful funds did indeed lag less often than the less successful funds (measured as the number of rolling 36-month periods during the 20-year span where the decile grouping had negative average excess returns).
- source: Morningstar Analysts
But it's not like these successful funds were strangers to underperformance. In fact, the top-decile funds lagged their indexes in more than one of every three rolling three-year periods. Put another way, investors in these funds spent roughly a third of the past two decades looking up, not down, at the index. What's more, the shortfall was significant--on average, the top-decile funds underperformed by 274 basis points annually during these lagging three-year periods, as shown below.
- source: Morningstar Analysts
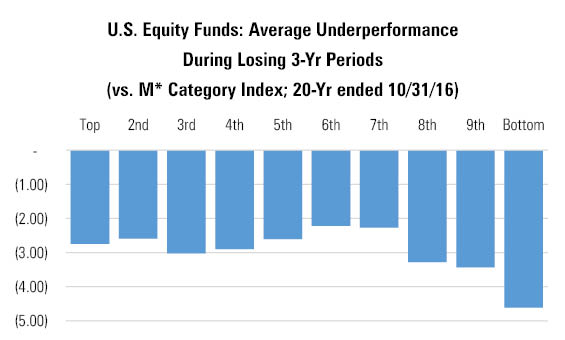
So then, perhaps you reason, "Sure, they fail, and, yeah, it's not immaterial when they do. But it probably doesn't get as bad as it does for the worst funds'. Right again, but only to a point: At their worst, winning funds tended to underperform their indexes by a smaller margin, on average, than the losing funds did. But it's not like they didn't throw pick-sixes (into heavy coverage, off the back foot) like Jay Cutler.
To illustrate, the chart below plots the average worst three-year underperformance the funds in these decile groupings suffered during the 20-year period I examined:
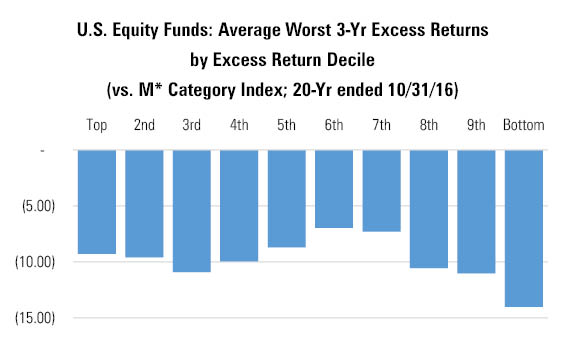
- source: Morningstar Analysts
At their very worst, the very best funds underperformed by more than 9 percentage points per year, on average. That's not a good look.
To those who would argue that this study is oversimplistic or incomplete in that it considers return but not risk, guilty as charged. Indeed, when we account for measures of risk like standard deviation, it is possible that it would scramble our decile groupings a bit. But the reason I conducted the study in this way is because investors often choose funds in a rather simple and, yes, incomplete way by chasing returns. Therefore, the study sought to simulate that practice (which prevails not just among retail investors but also the “professional” investors who serve them).
Conclusion and Takeaways To summarize, in fund investing it is often the case that the look of a winner is a loser. Long-term outperformers suffer large drawdowns just like losing funds and frequently lag their indexes over the short term, sometimes by dreadfully large margins. These episodes are likely to feel awful.
Given that, the takeaway for investors should be clear enough--calibrate your expectations appropriately upfront. This means seeing underperformance for what it is--an inevitability--rather than a worst-case scenario that immediately triggers regret and the impulse to sell when it arrives. If it’s gonna happen--and you can bet it will--then it’s far better to reckon with that likelihood beforehand instead of in real time.
How to go about that? Let’s face it--you’re probably more drawn to funds that have posted a strong performance run. Given this, it’s worthwhile to scrutinize that fund’s historical track record more closely to identify stretches where it underperformed. Once you’ve found those rough patches, ask yourself why the fund might have lagged as it did. Was it stylistic? Something peculiar to the way the manager built the portfolio? Asking questions like these can yield useful insights into the factors that could waylay performance in the future.
It's likewise important to determine why a "winning" fund has outperformed as it has. Is its success more or less the flip side of the factors that might have driven underperformance in the past? If so, does this imply the fund's recent strength might portend future weakness? It's not about predicting these outcomes with pinpoint accuracy but rather planning appropriately for a future pocked with setbacks.
(Note: If a fund’s track record is spotless, with not even a speck of underperformance on it, be wary. This is sometimes the case with young funds launched at a fortuitous time, when stylistic winds are at their backs, or that have been small enough to nimbly seize opportunities. Whatever the reason, what goes up in fund investing normally comes down, mean reversion being what it is. Thus, funds with pristine track records are better admired from afar than within.)
/cloudfront-us-east-1.images.arcpublishing.com/morningstar/HDPMMDGUA5CUHI254MRUHYEFWU.png)
/cloudfront-us-east-1.images.arcpublishing.com/morningstar/OMVK3XQEVFDRHGPHSQPIBDENQE.jpg)
:quality(80)/s3.amazonaws.com/arc-authors/morningstar/550ce300-3ec1-4055-a24a-ba3a0b7abbdf.png)