
A Balanced Batch of New Allocation Fund Ratings
Balanced funds come in all shapes and sizes.
/s3.amazonaws.com/arc-authors/morningstar/44f33af1-4d5c-42fb-934a-ba764f670bc6.jpg)
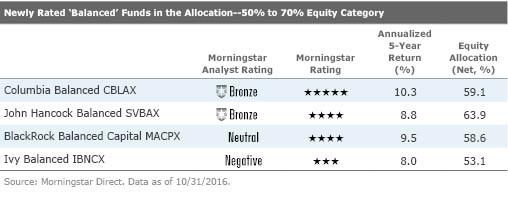
What's in a name? Not always much when it comes to balanced funds, which can come in an array of flavors despite having similar names. Here's a roundup of recently rated "balanced" funds that fall in the category of funds that generally have between 50% to 70% of their portfolios invested in equities. While their equity allocations may put them in the same peer group, their wide range of approaches can lead to very different performance patterns and results.
It's no coincidence that the two funds that operate within narrower tactical guideposts--
The results for
Portfolio managers that more widely vary their funds' asset allocations have a higher burden of proof to show that they deserve the leeway afforded to them. Even if the funds draw upon strong underlying investments, top-down allocation decisions can easily overwhelm a fund's overall results. That's one of the main reasons why
Columbia Balanced Blended Index: 60% S&P 500/40% Bloomberg Barclays U.S. Aggregate Bond. Tactical: Plus/minus 5 percentage points.
Columbia Balanced benefits from long-tenured managers and a proven, sensible approach, both of which help it to earn an Analyst Rating of Bronze. Leonard Aplet has led the fund since its 1991 inception using a straightforward allocation process that makes some top-down adjustments but primarily allows bottom-up research and security selection to shine. He considers various macroeconomic inputs to determine asset-class weightings, generally keeping the fund's equity portion at 55% to 65% of the portfolio. Low interest rates led to an equity stake near the upper limit of the range following the 2008 financial crisis. But equity valuation expansion since that time, along with slower earnings growth, contributed to Aplet's decision to lower the fund's equity stake; the team has maintained a 60% equity weighting since late 2014.
Aplet, along with comanagers Ronald Stahl and Greg Liechty, also run most of the fund's fixed-income sleeve. They keep duration within 0.5 years of the Bloomberg Barclays U.S. Aggregate Bond Index and use historical relative yields and valuation characteristics as a guide for their sector-rotation decisions. Brian Lavin manages the fund's high-yield sleeve; at about 4.4% of fixed-income assets as of August 2016, the weighting here is lower than the 22% high-yield allocation held by the typical allocation fund with 50% to 70% in equities.
Guy Pope employs the same time-tested approach for the equity portion that he uses at Bronze-rated
Attribution results show that Pope's stock-picking has been the main driver of this fund's success. Since he started managing the sleeve using the Contrarian Core process in early 2005, the fund's annualized return of 7.7% has bested the 60% S&P 500/40% Bloomberg Barclays U.S. Aggregate Bond blended index by 1.2 percentage points annually through September 2016. During that time, Columbia Contrarian Core's 9.6% annualized gain came out 2.3 percentage points ahead of the S&P 500. --Gretchen Rupp
John Hancock Balanced Blended Index: 60% S&P 500/40% Bloomberg Barclays U.S. Aggregate Bond. Tactical: Equities and bonds can range from 25% to 75% of assets (the fund usually stays within plus/minus 5 percentage points of its 60/40 target).
The experienced team at John Hancock Balanced has ably carried out the fund's straightforward approach for more than a decade. The process has delivered consistently strong long-term results, and taken altogether, the fund readily earns its Bronze rating.
Lead portfolio manager Roger Hamilton has been at the helm of this fund since 2003. He and Michael Scanlon, who has been with the team since 2007 and a manager since 2015, determine the fund's stock and bond split. They've generally kept the equity sleeve between 55% and 65% of assets, varying the stake based on individual security opportunities as well as broader macroeconomic inputs. The moves tend to be long-term in nature and have been mostly additive; they include avoiding non-U.S. stocks since 2009 and pivoting into larger-cap names over the past five years.
Those decisions stemmed from Hamilton and Scanlon's other responsibility on the fund--picking stocks by looking for strong businesses selling at a discount. They've found U.S. mega-cap financial firms especially attractive; the fund has 20% of its equity sleeve in this sector, compared with 16% for the S&P 500. At 2% of the portfolio,
The fund's bond holdings mirror those at John Hancock Bond JHNBX. That fund's high-yield bond stake--it constituted 22% of assets as of June 2016 compared with 7% for the typical intermediate-term bond fund--has propelled returns and volatility, though its risk-adjusted returns land near the group's top. John Hancock Balanced's high-yield stake is comparable with other allocation funds that hold 50% to 70% of assets in equities.
Attribution analysis shows that the fund's three levers--allocation, equity, and fixed-income decisions--all contributed to its strong results. Over Hamilton's tenure through August 2016, the fund gained 8.9% annually, beating a blended 60% S&P 500/40% Bloomberg Barclays U.S. Aggregate Bond Index and the typical peer by 1.3 and 2.5 percentage points, respectively. --Janet Yang
BlackRock Balanced Capital Blended Index: 60% S&P 500/40% Bloomberg Barclays U.S. Aggregate Bond. Tactical: Plus/minus 10 percentage points (it usually stays within plus/minus 5 percentage points of the 60/40 target).
BlackRock Balanced Capital adheres to a simple approach that has posted mixed results, and the underlying strategies don't uniformly inspire confidence that the fund will buck that trend. These considerations outweigh an attractive price tag and drive the fund's Neutral rating.
Lead manager Phil Green, who heads BlackRock's global tactical asset-allocation team, doesn't make big moves here. This fund targets a 60/40 split between stocks and bonds and rarely strays more than 5 percentage points from that split. During the past three years through July 2016, the fund's equity exposure only marginally exceeded 65% of assets twice and never fell below 56%. In the first half of 2016, the team began using exchange-traded funds and futures positions to express tactical views, but it doesn't expect to veer much from historic norms.
The fund's success or failure largely depends on its two main holdings: BlackRock Large Cap Core and BlackRock Total Return. These two strategies have remained the fund's building blocks over the years, even as they underwent changes in management following severe underperformance. BlackRock Large Cap Core's one-year return lagged its Russell 1000 Index benchmark by nearly 700 basis points when former manager Bob Doll exited in June 2012. Current manager Peter Stournaras has struggled to pull ahead since then, as the strategy's 13.9% annualized return through July 2016 trailed its benchmark's 15.3%. On the bright side, Rick Rieder has brought stability to BlackRock Total Return since taking the helm in August 2010, and it has delivered roughly 70 basis points of annual outperformance through July 2016. (That strategy's mutual fund is rated Silver.)
This approach has tasted success but hasn't lived up to expectations. In recent years, the fund's U.S.-focused equity exposure has proved advantageous relative to peers, which typically hold more in international stocks. Still, the fund has struggled to keep up with its own custom blended benchmark owing to BlackRock Large Cap Core's underperformance. --Jeff Holt
Ivy Balanced Blended Index: 60% S&P 500/40% Bloomberg Barclays U.S. Government/Credit. Tactical: Equities can constitute between 0% and 75% of the fund's assets.
Matthew Hekman took over Ivy Balanced in August 2014 when longtime manager Cynthia Prince-Fox moved to
Hekman's limited experience making asset-allocation decisions doesn't inspire confidence, particularly given the fund's flexible approach. He joined Waddell & Reed--Ivy's parent company--in 2003 and served as an equity analyst and then as an assistant portfolio manager on large-cap equity strategies before taking over this fund. Hekman has much more flexibility here than with his prior roles, though. He can invest up to 75% of the fund's assets in equities, and between 25% and 100% in fixed income (including cash). Hekman's ability to successfully execute asset allocation and security selection remains unknown.
Hekman doesn't receive sufficient support to offset his inexperience with asset allocation. He doesn't have any comanagers, but he can draw on ideas from the firm's central pool of analysts, as well as from other portfolio managers. However, a recent wave of turnover has reduced resources. Seven analysts resigned in 2016, and Waddell & Reed is evaluating whether it will fill those positions. In the meantime, existing analysts' coverage loads have increased. This casts doubt on the firm's ability to adequately support the fund.
Hekman's changes to the portfolio since taking over haven't translated to inspiring results. Concerned about slowing earnings growth, Hekman cut the fund's equity stake by roughly 20 percentage points to 47% as of June 2016--the lowest in the fund's history. That move hurt the fund as the S&P 500's 7.8% annualized return nearly doubled the Bloomberg Barclays U.S. Government/Credit Index's 4.1% gain over Hekman's tenure through September 2016. As a result, the fund's 2.5% annualized return over that same period trailed the typical peer in the allocation--50% to 70% equity Morningstar Category. --Susan Wasserman
:quality(80)/cloudfront-us-east-1.images.arcpublishing.com/morningstar/OMVK3XQEVFDRHGPHSQPIBDENQE.jpg)