
Third-Quarter GDP: Half Empty or Half Full?
Despite glowing headlines, we think the economy turned in a poor performance in the third quarter.

Markets had yet another relatively slow week, performance-wise, with economic data providing little clarity to the situation. However, world PMI data released on Monday suggested that purchasing managers in many countries, including a few laggards, are feeling better about the economy and worrying less about Brexit, central bankers, and U.S. elections.
Other manufacturing data, notably durable goods order data, also seem to be making an important bottom, a claim that we have wrongly made before. And new home data suggested that, just maybe, the housing market was poised to do a little better, too.
The big daddy of economic reports, third-quarter GDP data, turned out to be a non-event, as just about any observer, even those with widely differing views, could find a way to bend the data to show things were getting better or they were falling apart. As usual, the truth likely lies in the middle, perhaps a smidge toward the problematic side, as we explain below.
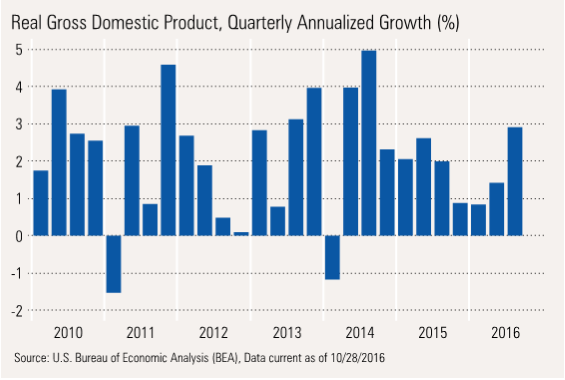
GDP Report: Half Empty or Half Full? News outlets were falling all over themselves to write the most positive headline they could about the third-quarter GDP report. Who could blame them? Measured on a seasonally adjusted, sequential growth rate, which is then annualized, GDP grew at an apparently powerful 2.9% rate, snapping a streak of poor growth quarters. In the first and second quarter, the economy grew a paltry 0.8% and 1.4%. The headline number also beat our 2.4% forecast and consensus estimates that ranged between 2.5% and 2.8%. In that context, some of the media's puffery might be justified, right?
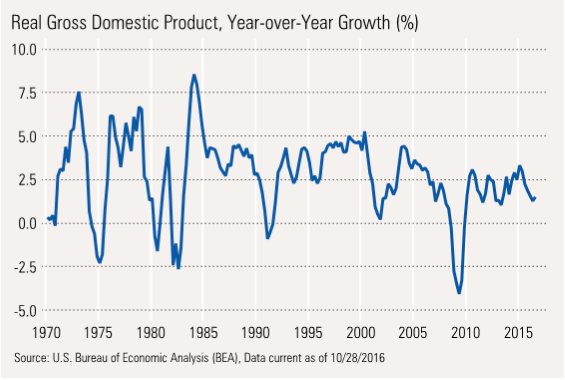
However, looking at the same data on a rolling 12-month basis (which mimics full-year GDP calculations, except they can be calculated every quarter), the economy is continuing to falter. From mid-2015 to the just-ended third quarter, GDP growth has fallen from 2.9% to 1.6%. Even if the fourth quarter produces close to 3% growth again, the full-year GDP growth rate for 2016 is likely to be around 1.6%, much lower than the anomalous 2.9% growth rate in 2015.
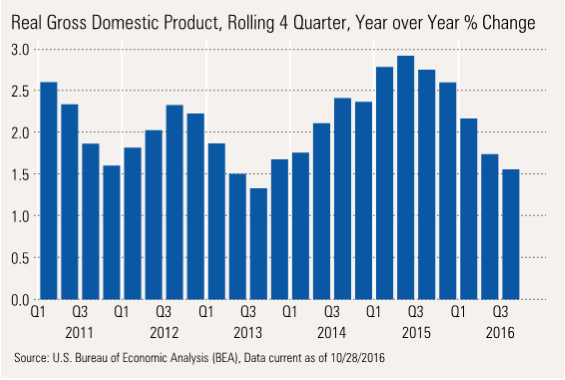
So which chart to believe: the quarter-to-quarter data that shows a rebounding economy after a slow spell, or the second chart that shows an economy that is clearly trending down? We believe the truth is closer to the second image, though not quite as dismal as the chart might suggest.
Sequential Data Too Jumpy to Make Any Firm Economic Assessments Note how the quarterly annualized data jumps all over the place and looks almost looks like a random walk pattern. The charts show big upside bursts but some negative quarters, too, even in the context of a long-running recovery. Weather, especially abnormal patterns, natural disasters, and tough-to-adjust seasonal factors make this a less-than-reliable data source.
These issues are amplified by the fact that we take a quarter-to-quarter change and amplify it by annualizing, roughly multiplying the raw data by a factor of 4. In the most recent quarter, GDP grew by about 0.75%, and then that number was annualized to 2.9%.
Even worse, massive changes in small categories can have dramatic effects on sequential numbers, but that effect is much smaller on annual numbers, unless that category continues to have outsize moves for four quarters in a row. For example, a small but surely temporary boost in soybean exports dramatically moved GDP growth higher in the third quarter. Overall exports, including a large soybean anomaly, added a whopping 1.2% to GDP growth. If soybeans turn out to be a one-quarter rocket, as we believe, then net exports are likely to contribute just 0.3% to annual GDP growth, all else being equal.
Rolling Four Quarter Data Offers More Useful Trends and Less Noise, but Less Timely Signals Notice the four quarter growth bars seem to go in the same direction for several months in a row, that the incremental changes are much more mellow, and that the range of outcomes narrows sharply compared to seasonally adjusted, sequential quarters. Rolling data since 2011 has ranged from 1.3% to 2.9%, which makes a lot more sense than the -1% to +5% data shown in the quarterly sequential data. Unfortunately, the rolling data is still forming its bottom, having already dropped from 2.9% to 1.6%, with potentially one more downtick. However, the sequential data and the year-over-year data suggest that the bottom could be approaching, if we don't pile on another anomaly in the fourth quarter.
Even the Sequential GDP Growth Had a Couple of Ringers, Suggesting It Was a Tough Quarter While headline GDP growth of 2.9% sounded pretty darn good, 1.2% of that growth was due to export growth, primarily agricultural-related products. And after five quarters of inventory shrinkage, inventories managed to tack 0.6% onto the GDP calculation. Without those two items, GDP growth would have been a more problematic 1.1%. That's not a totally fair adjustment to make, but certainly the headline number had at least some help from special factors, however you may want to quantify them.
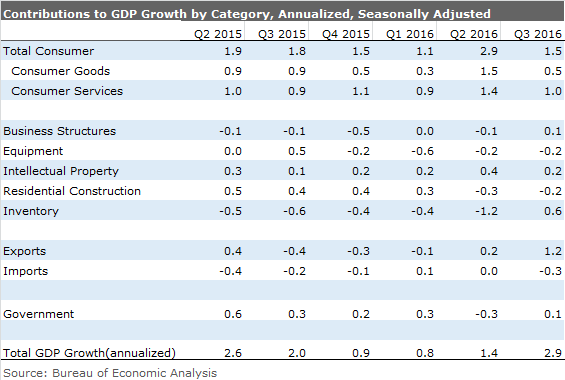
Offsetting those pleasant surprises, consumption data disappointed, business equipment was down, and residential buildings fell for the second quarter in a row. These three items are in the heart of the economic order, and demonstrating some relatively serious issues, at least in the short run. After reading the headline number, I head first to these three "must have" categories. This time, I swore I must have read the headline wrong, because these categories did so poorly, and yet the headline was so strong.
Most worrisome, consumption missed forecasts and was below prior-quarter results. Consumption, at 70% of GDP, is critical to overall economic growth and indirectly drives other GDP categories. Consumption grew just 2.1% in the quarter, down from a non-sustainable 4.3% in the second quarter and modest quarterly averages that have hovered around 2.3% for most of the recovery. It also missed what we thought was our conservative estimate of 2.6% growth from data already released. Although potential restatements of past months will likely confuse issues, it would seem consumption potentially fell in the month of September compared to August. That's happened only a handful of times since the recovery began, and most of those were weather-related issues. However, we caution that these numbers will likely be revised some in the months ahead.
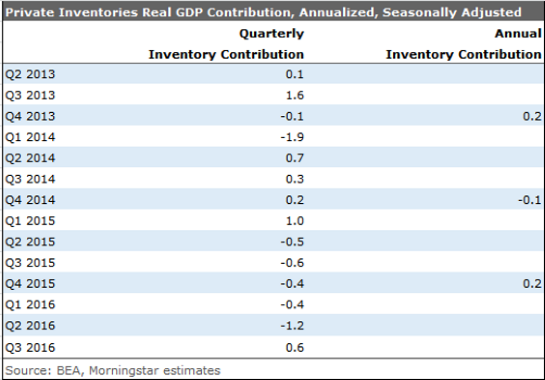
In a Piece of Good News, Inventories Stopped Shrinking With expectations of higher growth and higher inflation, inventories had been slowly building over the recovery. There were often massive swings in inventory in a given quarter, but they almost always reversed themselves, and a small general uptrend was visible.
That all changed in 2015, when inventories started five quarters of decline as growth proved to be disappointing. If, indeed, GDP does begin to stabilize, inventories will need to be rebuilt in some situations. In any case, it's unlikely that inventories will continue to be a drag on GDP growth. That would remove a headwind from GDP that has averaged over 0.5% for more than a year.
Residential investment took 0.2% off the GDP calculation for the second decline in a row. Housing has been a steady-Eddie of this recovery, so two quarters of falling data is not a great sign for the economy--especially, since housing activity results in additional activity in future quarters, including furniture sales, mortgage services, remodeling, and moving services. The pain from this slowing could continue to manifest itself even if housing were to turn around immediately. The good news is, at least the rate of decline was smaller in the third quarter than the second, and at least some housing data (with the exception of multifamily housing activity) seemed to get better throughout the quarter.
The net export numbers have been a bit flaky for a while. Export growth has generally slowed with a stronger dollar and a weaker world economy, as one might expect. The export decline had moderated some in recent quarters but had a large pop in the third quarter, growing at an annualized 10% rate. Most of the gain was related to jump in ag shipments, mainly soybeans shipped from inventory. It appears that was a temporary blip with ag exports already fading strongly in the month of September. Sadly, this big bump won't do much for U.S. employment levels, except maybe a few dock workers.
Less well known is that import grow has faded nearly as much as export growth, which doesn't fit with a strong dollar and a relatively stronger consumer. In fact, consumer goods are down about 8% September over September. Consumer preference for experiences, healthcare, and U.S. produced goods appears to have taken a real toll on imports. We are not so sure how long that trend will continue. Maybe renewed iPhone shipments will bring imports back up to more normal levels.
Slow Year-Over-Year Growth Raises Questions About Employment Growth Non-government-related GDP and total hours worked are highly correlated, with the GDP data generally moving slightly before hours change. With year-over-year GDP still going down, we are a bit worried that employment growth has one more quarter of decline in front of it, even if the year-over-year rate stabilizes in the fourth quarter.
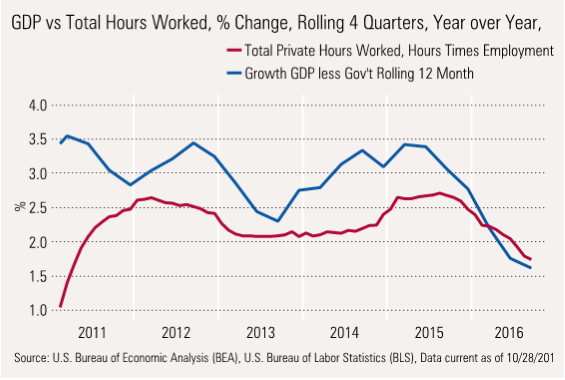
The GDP data suggests employment growth of 1.5% or less, which should roughly translate into 150,000 to 175,000 jobs per month. That is certainly not as good as the 200,000-plus number of 2015, but not a complete disaster, either, especially if wages keep moving up.
Remember That Demographic Issues Will Keep GDP Trending Down Although current GDP data is a little jumpy, the longer-term trend of slower growth persists. The slowing is driven by slower population growth, limited workforce growth, and baby boomer retirements. We believe that 1.5% to 2.0% will become the norm instead of the 2.0% to 2.5% we have come to expect during the current recovery, and even further below the 3.1% long-term average GDP growth rate of the last 65 years.
In Manufacturing, Some Modest Signs of Hope We wished manufacturing was a bigger part of the economy in 2013 and 2014 but have been very happy that it is only 12% or so of GDP in recent quarters, as manufacturing industrial production has slipped to zero. We have seen mirages of a rebound since mid-2015, only to have our hopes dashed by yet another horrible revision or yet another sector falling into the abyss just as another was pulling out. For far too long, we have hoped the oil-related problems would stabilize and better manufacturing growth rates would be around the corner.
With that caveat, it appears that just maybe we are at that potential turning point yet again. This time, it is the world purchasing manager data that is looking better. What's hopeful about this metric is that most regions are improving, not just one region benefitting at the expense of another region. Flash data out of Europe, the U.S., and even Japan showed some strong improvement in September, powerful enough that the improvements remain visible in three-month averaged data, as shown below.
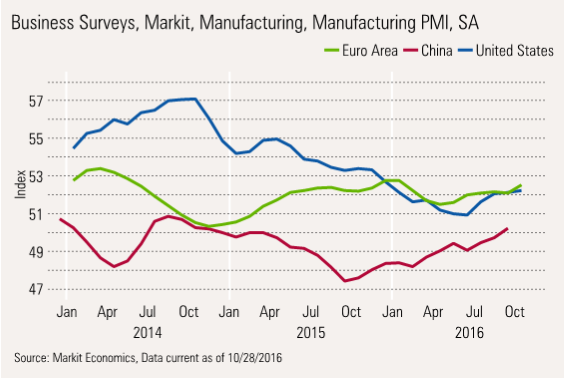
New order components of the indexes, the most forward-looking, predictive components, registered some of the best improvements, suggesting continued improvements in output and employment in the months ahead. The breadth of the improvements around the world suggest something more permanent may be at work in the world economy.
We caution that some major countries, notably China, don't report flash data. We also warn that greater certainty around the U.S. election and less fallout than expected from Brexit may have helped these indexes along. While the surveys are supposed to be based on objective data, they reflect subjective outlooks, which do seem to be improving.
The U.S Durable Goods Report Shows Some Further Potential for U.S. Manufacturing The durable goods report is highly volatile and needs to be massaged a bit to make it useful in economic analysis. As this is an orders report, production and shipments should follow improving data found in portions of the report for September.
The shorter-term durable goods orders seemed to have formed a definite uptrend, while the longer-term, bigger-dollar capital goods data hasn't shown as much improvement, at least not yet. That fits a general pattern of businesses feeling slightly more at ease, but still being unwilling to bet the ranch on big new investments.
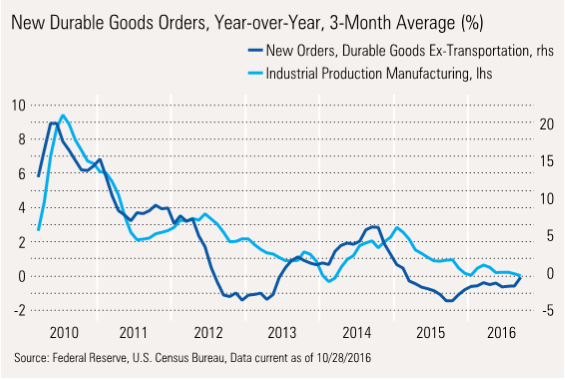
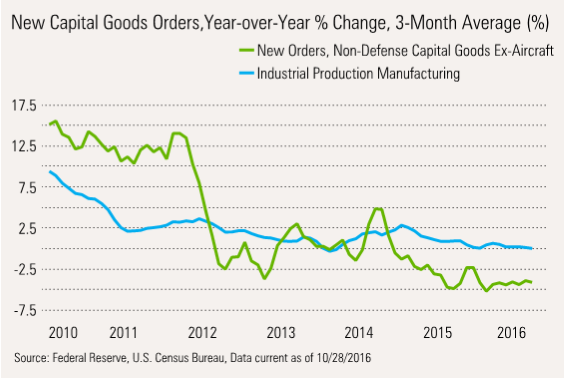
Note that orders for both types of durable goods are graphed with manufacturing industrial production. Generally these orders are relatively predictive of industrial production. There are more caveats than I care to mention here, but the data seems to be making a turn for the better, and at least it won't likely be an anchor to GDP performance.
Housing Gets Some Good News at Last Housing data has been nearly impossible to read lately, as weather, last year's paperwork snafus, jittery mortgage rates, and the New York City tax credit are affecting different data sets at different times. Rolling 12-month data seems to smooth the rough edges a bit, but not entirely.
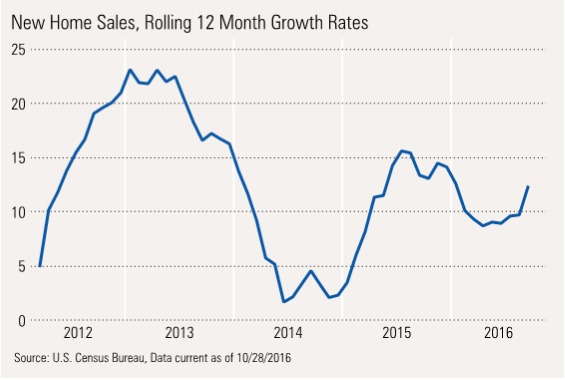
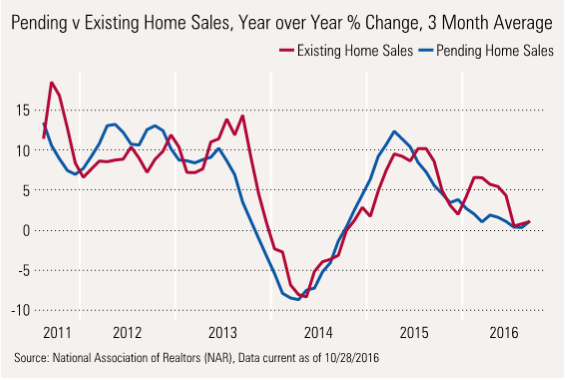
We haven't been thrilled with existing home sales for a while, and this week's report on pending home sales suggest little or no growth in the months ahead. New home sales are doing much better, which is great since they make a much larger contribution to GDP. The new home sales report has seen steady increases in unit sales, and the single month report for September was the second best of the entire recovery, closing in on 600,000 annualized units. The momentum here looks good, but again this is just one month's report, and apartment building activity will offset the small improvements we are seeing in new single-family home sales.
We still think the back-to-back quarterly GDP subtraction from all residential investment seems to be a little worse than some of the unit housing data suggests. Part of that is due to seasonal factors and weather and annualizing volatile quarterly data sets. We are generally optimistic about closing out the year on a stronger note. The only fly in the ointment is good news or bad news, depending on your point of view. Builders seemed to have gotten the message that buyers are interested in more affordable housing. This is decidedly helping unit sales. Paradoxically, lower average price growth may be suppressing total spending on homes, providing yet another barrier to improvement in the housing sector.
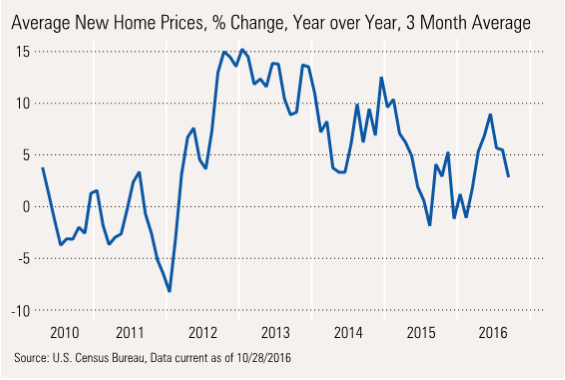
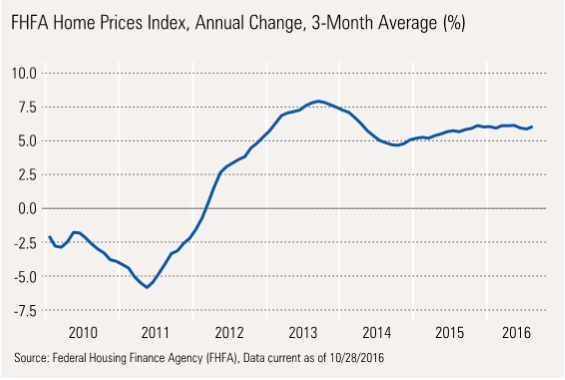
New home prices are no longer outpacing normal home price growth, as measured by the FHFA. Growth here remains stuck between 5% and 6%. The good news here is that we are moving in the right direction, and price growth is not accelerating. Last time there was a big acceleration (2013), it was disastrous for home sales of all types.
Pending Home Sales Going Nowhere Fast As we mentioned, the existing home sales index was little changed month to month or year over year, suggesting we will continue to see existing home sales showing little unit growth in the months ahead. The correlation between new and existing home sales is a strong one, as shown below:
/cloudfront-us-east-1.images.arcpublishing.com/morningstar/ZYJVMA34ANHZZDT5KOPPUVFLPE.png)
/cloudfront-us-east-1.images.arcpublishing.com/morningstar/MNPB4CP64NCNLA3MTELE3ISLRY.jpg)
/cloudfront-us-east-1.images.arcpublishing.com/morningstar/F2S5UYTO5JG4FOO3S7LPAAIGO4.jpg)