
Our Economic Ocean Liner Is Taking a Turn for the Worse
One by one, the pillars of the U.S. recovery are beginning to fade.

World markets showed little change for the week with a small bias on the upside as most major markets added less than 0.5%. The exception: emerging markets that were up closer to 2% as fundamentals in many countries are grudgingly improving while developed markets are facing Brexit and election issues, suppressing gains.
Economic data did little to dispel the uncertainty, as most of this week's data was inconclusive, despite a lot of releases. Even neutral arbiter Atlanta GDPNow's report barely changed its GDP forecast, from 1.9% last week to 2.0% this week, and all of that was based on a small increase in government spending.
With the GDP report due next week, the consensus estimate GDP forecast of 2.8% is uncomfortably high relative to the GDPNow forecast of just 2.0%. We believe the actual result will likely split the difference at 2.4%. All of those numbers are based on sequential, annualized growth rates. The more important year-over-year third-quarter GDP growth rate is likely to hover very near the 1.3% growth rate of the second quarter--nothing to write home about, and near recovery lows.
Offsetting this glum GDP analysis, earnings news was generally better than expected during a week with a lot of reports. The new blended average forecast for S&P 500 earnings calls for a decline of just 0.3%, better than the 1.8% decline being estimated just last week. With just a few more upside earnings surprises, final third-quarter earnings could end up being positive for the first time in six quarters. However, the energy sector is weighing down those figures. Without energy, only the second quarter of 2016 showed a decline, and growth of 3.4% is being anticipated for the third quarter. So as queasy as I feel about the economy, earnings seem to be looking up a bit, and merger and acquisition news heated up, too.
Still, a softening economy will eventually influence earnings and stock prices. Poor economic news might also keep interest rates lower for longer, which could at least temporarily excite markets. So despite a slowing economy, markets still might hold together--though that is not a chance I am willing to take.
One by One, the Pillars of the Current Recovery Are Beginning to Fade Much of today's economic analysis focuses on macro factors, especially interest rates. However, a lot of the growth has come from a collection of smaller groups doing well. This initially included autos, airliners, and the shale-related energy boom. Those factors peaked some time ago, and healthcare and restaurant meals accelerated to take their place. Now with the Affordable Care Act mostly in place, and employment growth slowing, those sectors are fading, too.
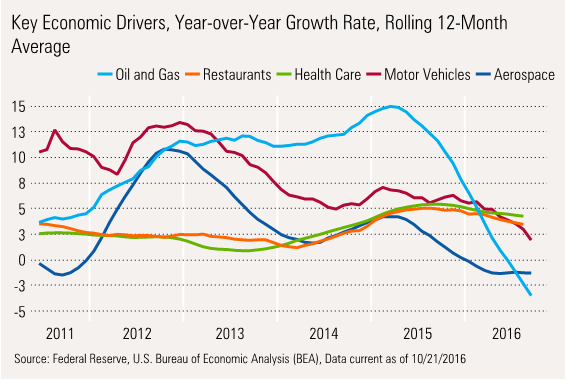
Even we were a bit surprised to see many categories peaked out. At the moment we can't identify many sectors that would be able to fill the void. (We do admit those stronger sectors are hard to locate unless you know exactly where to look.) We also note that a minuscule cost-of-living adjustment for Social Security and related beneficiaries (1 in 6 Americans) will provide a further headwind. Also, the housing news, viewed from a longer perspective, seems to be slowing, too, as we discuss below.
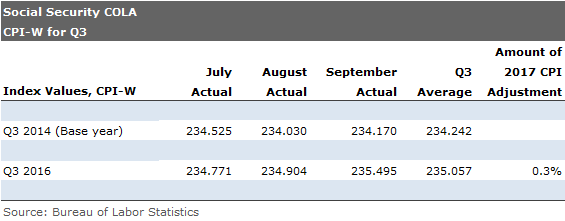
Low Inflation Brings the Side Effect of a Low COLA By looking at data from July and August, we were relatively sure the cost of living adjustment for Social Security recipients would be less than 0.5%, as we noted a month ago.
As it turns out, the adjustment will now be just 0.3% with the official report for September. That follows no increase in 2015. Hardly great news for seniors who spend more on rapidly inflating healthcare expenses and less on declining gasoline and clothing indexes than the broad indexes assume.
Proving there is plenty of pain to go around, the new "limit" on Social Security wages will be going up from approximately $118,000 to $127,000, hitting high-wage earners hard later in 2017.
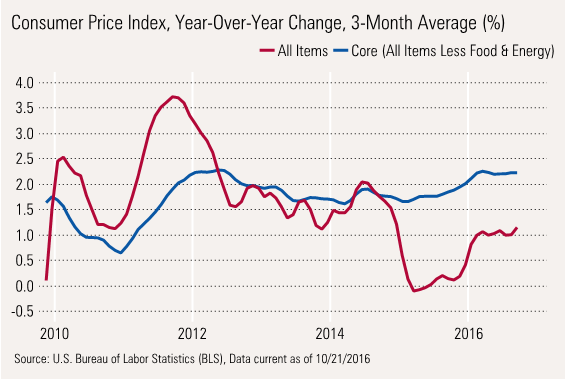
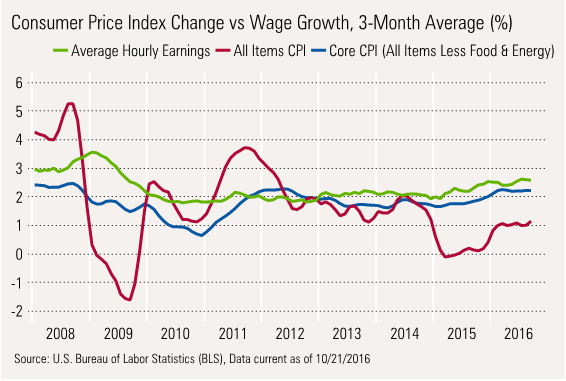
Inflation: More of the Same, With Danger Lying Around the Corner Headline or all-in inflation remained stuck in the 1.0%-1.1% annual range as it has every month since February, as shown in the far right column below.
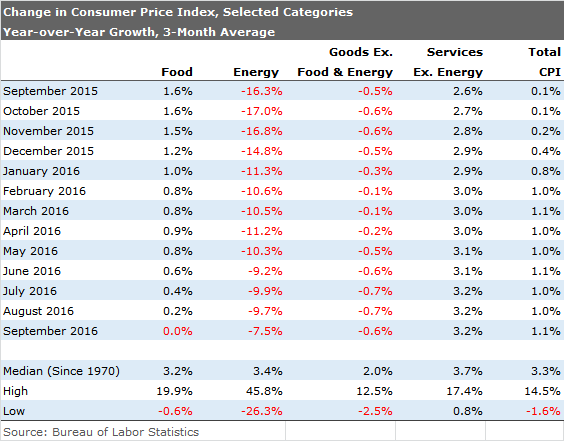
Note, however, that food inflation is lower, energy deflation is much lower, and the huge services category (about 60% of the index) continues to power ahead. With energy prices stabilizing, we suspect it's unlikely that energy deflation will help the CPI calculation, and by the middle of next year headline inflation will approach the core inflation rate of 2.2%. Even that core number has the potential to move higher.
Wage Earner Inflation Spread Will Likely Disappear, TooHistorically, wage growth has moved in line with core inflation. Employers don't make wage adjustments for items that can quickly reverse themselves. (Over the long term, core inflation and headline inflation are about equal.) Since 2015, workers have enjoyed wages moving up with the core rate, and total inflation was substantially less (that is, if you spend money the same way the CPI assumes you do). However, as core and headline inflation approach each other, that puts a real hole in consumer spending for 2017.
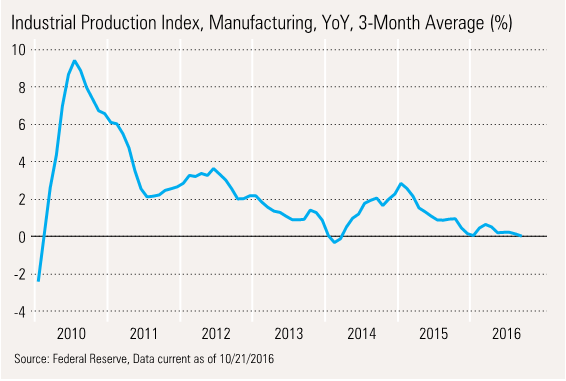
Industrial Production Continues to Sputter Some economists were excited that manufacturing industrial production in September increased after a recent decline. We were less than thrilled because the long-term chart still looks terrible. That's not great for a sector that accounts for 12% or so of GDP.
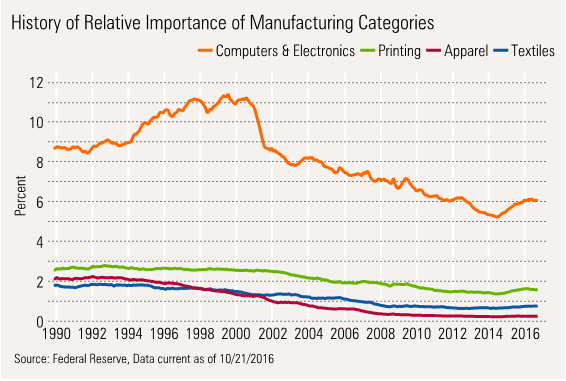
Poor Industrial Production Performance Driven by Computer-Related Products
We lined up the four worst-preforming industrial sectors since 1990 and were truly astounded by the results. As expected, printing, apparel, and textiles all showed sizable declines. However, even putting these three laggards together doesn't add up to what was lost in computer hardware and semiconductors.
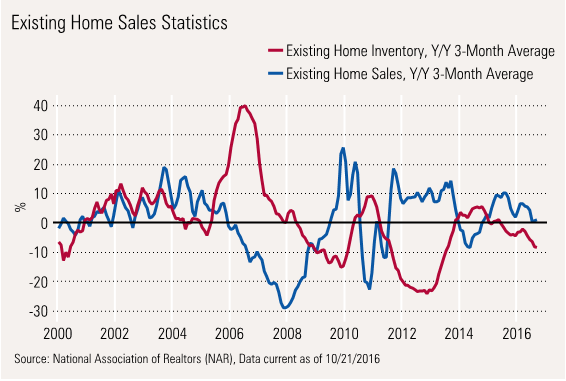
Housing Data Another Mixed Bag; Safe to Say It Won't Be an Economic Savior
Like the industrial production data, many investors took solace in the fact that existing-home sales were moving up again, as shown below.
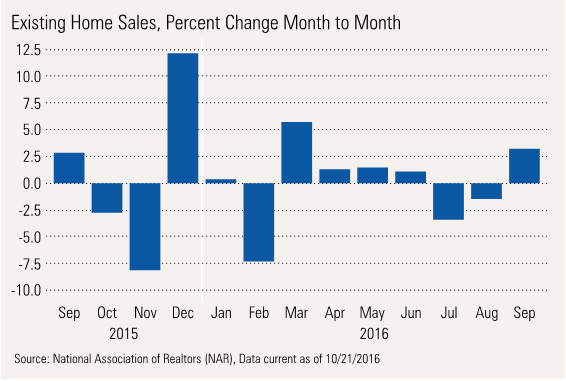
However, before one gets too excited, the year-over-year data is stuck in a terrible downdraft with no year-over-year growth in existing-home sales. Poor inventories suggest the problem may persist.
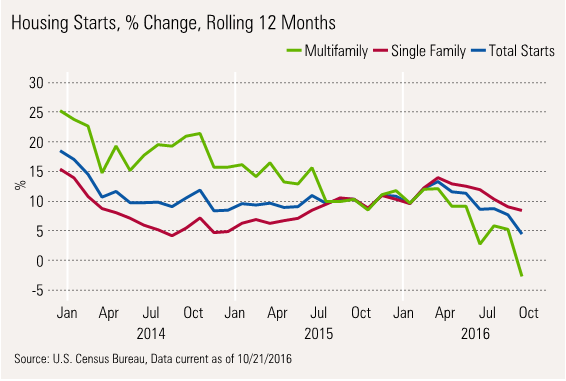
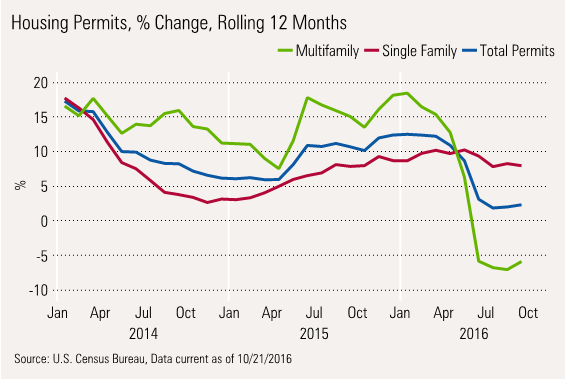
Housing Starts and Permits Not Looking Good, Either
Both starts and permits continued in a downward trend. Single-family homes are faring better, but the results still show a clear pattern of slowing growth. That is better than the outright declines being experienced by the multifamily sector, though.
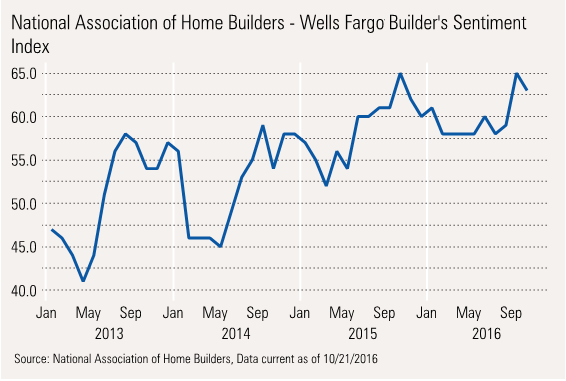
Meanwhile, builder sentiment is down, but not nearly as bleak as starts and permits.
/cloudfront-us-east-1.images.arcpublishing.com/morningstar/T5MECJUE65CADONYJ7GARN2A3E.jpeg)
/cloudfront-us-east-1.images.arcpublishing.com/morningstar/VUWQI723Q5E43P5QRTRHGLJ7TI.png)
/d10o6nnig0wrdw.cloudfront.net/04-22-2024/t_ffc6e675543a4913a5312be02f5c571a_name_file_960x540_1600_v4_.jpg)