
Do Multiasset Volatility-Protection Funds Deliver?
A simple blended index can protect you better.
/s3.amazonaws.com/arc-authors/morningstar/44f33af1-4d5c-42fb-934a-ba764f670bc6.jpg)
We recently released a study of the generally disappointing results that much-hyped objectives-based investments have delivered to investors. A summary of the research can be found on Morningstar.com, and the full paper is on our corporate site. Today's article looks more closely at multiasset volatility-protection funds, one of the most heterogeneous subsets of objectives-based investments.
The 2007-08 financial crisis left many investors feeling understandably unmoored and searching for investments that could temper future bouts of such stomach-churning market volatility. Funds seeking to provide protection from similar downturns have multiplied since then: Of the 60 distinct strategies that we identified as volatility-protection funds, 47 have been launched since 2009.
The rather nebulous notion of "volatility" resulted in a motley group of funds compared with other objectives-based groups, and it could have been even more disparate. It's not uncommon, for instance, to see multiasset funds tout themselves based on their goal of providing lower volatility compared with equities. But by that yardstick, essentially any fund within the allocation Morningstar Categories should be expected to have lower volatility than equities, because by our category definitions, they must also hold fixed income.
To narrow the field, we concentrated on identifying funds in which volatility or downside protection appeared to be a driving component of their investment process. This still resulted in including relatively newer and more-esoteric investments, such as risk parity funds, which aim to balance sources of risk and then leverage up the resulting fixed-income-driven returns. More-traditional valuation-driven strategies, which can move assets in and out of cash depending on market opportunities, also fall into this group.
Not News: Multiasset Strategies Have Lower Downside Risk and Standard Deviation Than Equities As a group, volatility-protection funds do generally offer refuge when equity markets turn negative. Exhibit 1 shows that in months when the S&P 500 lost money, the typical volatility-protection fund captured only 87% of the loss. That figure is similar to the downside-capture ratio of all other non-volatility-protection multiasset funds. A comparable blended index of 40% equities and 60% fixed income handily beat both, capturing only 38% of the S&P 500's losses in down months. Volatility-protection funds have, on average, 20% of their bond sleeves invested in high-yield bonds, which would go a long way toward explaining the difference in downside capture between those funds and the blended index, which does not include high-yield fixed income. Protecting on the downside generally entails giving up some participation in up markets. On that measure, volatility-protection funds and the blended index perform similarly, with both capturing about half of the S&P 500's gains. Non-volatility-protection multiasset funds, which have an average equity allocation almost 10 percentage points greater, predictably offer more upside participation.
Exhibit 1: Volatility-Protection Funds Protect on the Downside, and so Does the Blended Index
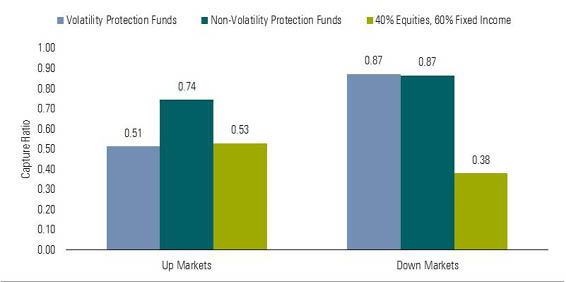
Average monthly up- and down-market capture ratios versus S&P 500, April 1, 2006, to March 31, 2016. Source: Morningstar
.
It's almost a tautology to assert that volatility-protection funds--or any multiasset fund--have lower standard deviations than the S&P 500. Exhibit 2 shows how that relationship has played out during rolling three-year periods throughout the past decade. Perhaps unsurprisingly given the downside behavior and lack of high-yield bonds, the standard deviation of the blended index is consistently lower than both groups of multiasset funds.
Exhibit 2: Volatility-Protection Funds Have Lower Standard Deviation Than Equities; Blended Index's Is Even Lower
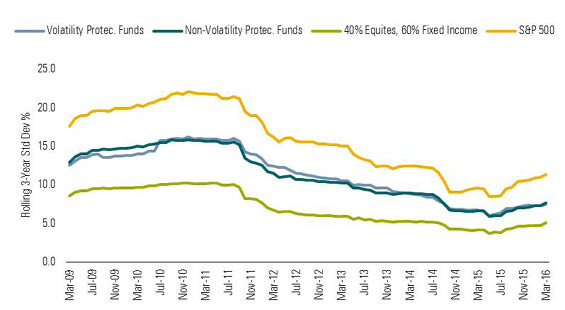
Rolling three-year annualized standard deviation, April 1, 2006, to March 31, 2016. Source: Morningstar
.
Index's Better Downside Protection Leads to Better Total and Risk-Adjusted Returns The blended index's overall better record of downside protection results in consistently more attractive total returns. Exhibit 3 shows how the index has fared against volatility-protection funds and other multiasset strategies using rolling three-year periods during the past 10 years.
Exhibit 3: Volatility-Protection Funds' Total Returns Consistently Lag Blended Index's
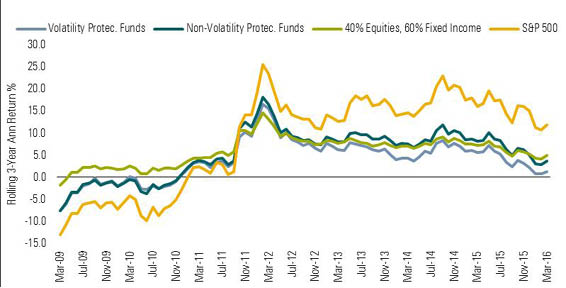
Rolling three-year annualized returns, April 1, 2006, to March 31, 2016. Source: Morningstar
.
Suffice to say, when considering risk-adjusted results, as measured through Sharpe ratios, the blended index looks even better. Exhibit 4 shows the funds' risk, return, and risk-adjusted results during the past decade through March 2016. The blended index's lower standard deviation helps keep its Sharpe ratio ahead of the S&P 500's; that's largely thanks to its Barclays U.S. Aggregate Bond Index stake, where a low-rate environment has helped produce some of the market's best Sharpe ratios during that time.
Exhibit 4: Volatility-Protection Funds Have Higher Standard Deviation, Lower Returns Than Blended Index
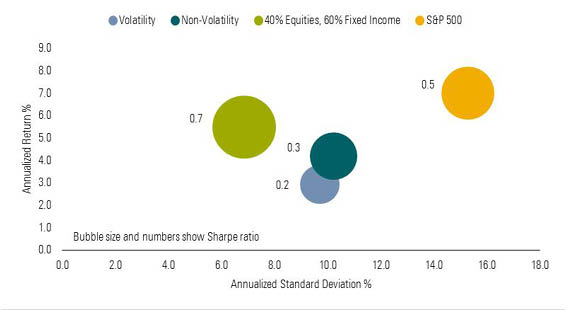
10-year annualized returns, standard deviations, and Sharpe ratios, April 1, 2006, to March 31, 2016. Source: Morningstar
.
Recommended Volatility-Protection Funds
The volatility-protection funds in which we have the most confidence rise above any vague notions of "volatility" to define the concept more concretely. For the teams at
BlackRock Global Allocation MDLOX
This fund aims to be a portfolio anchor and attempts to deliver equity-market-like returns with less risk. The fund's blended benchmark is a 60%/40% stock/bond split, including 36% S&P 500, 24% FTSE All-World ex U.S. Index, 24% Bank of America/Merrill Lynch 5-Year U.S. Treasury Bond Index, and 16% Citigroup Non-U.S. Dollar World Government Bond Index.
Management's aversion to permanent capital loss and investments that it believes don't compensate for their risks has driven the fund's success. Its nearly 10% annualized gain from its 1989 inception through Dec. 31, 2015, beats the 7.3% annualized gain of the typical world-allocation fund. A $10,000 investment made in 1989 was worth more than $132,000 at the end of 2015, while the same deposit in its custom global stock, bond, and cash benchmark was $69,000. The fund has captured more than 100% of that category's upside and 85% of its downside. —Dan Culloton
FPA Crescent FPACX
This fund's stated mission is to deliver equitylike returns with less risk than the stock market, a hurdle that lead manager Steve Romick has far exceeded since the fund's inception. Indeed, its 10.3% annualized gain from its June 1993 launch through May 30, 2016, beats the S&P 500 by 1.3 percentage points per year, while its standard deviation, a measure of volatility, was 31% lower than the index's. FPA Crescent has won by not losing. With an oft-heavy cash stake, it will lag in some rallies. From its 1993 inception through the end of April 2016, it captured 69% of the S&P 500's gains in upturns. However, it was able to preserve those gains in rough environments, suffering just 46% of the index's losses in downturns.
The fund ranges across asset classes, market caps, sectors, geographies, and public and private markets. Romick and team, who can also short securities, are absolute value investors who view risk as the possibility of suffering permanent loss, not of underperforming a benchmark or peer group. They seek securities trading at substantial discounts to their estimated worth and stockpile cash when they can't find them. —Dan Culloton
AQR Risk Parity AQRIX
Management allocates risk equally across four buckets--global equities, global bonds, inflation-hedged assets (two thirds commodities, one third inflation-linked bonds), and credit/currency--then adjusts those allocations based on its tactical models. One area in which AQR distinguishes its process is its approach to risk. The fund's 10% volatility is achieved, as is the case with other risk parity strategies, with the aid of leverage. AQR generates forward-looking volatility estimates for each asset class, then keeps unusually close tabs on volatility, monitoring it and rebalancing to target levels on a daily basis. Moreover, management incorporates several constraints to help manage the risk of leverage. Those include exposure limits at the asset-class and sub-asset-class levels (generated through stress-testing), gross exposure caps, and a systematic drawdown process run through a separate companywide risk-management function.
Commodities play an intrinsic part of nearly all risk parity strategies, but they also introduce greater unpredictability to returns; they have been a significant drag on this fund's returns in recent years. From its October 2010 inception through April 2016, the fund is ahead of the category on a returns and Sharpe ratio basis, but it significantly lags its blended benchmark (4.98 % annualized return for the fund versus 7.08% for the benchmark, and a Sharpe ratio of 0.57 compared with 0.91). —Josh Charlson
/cloudfront-us-east-1.images.arcpublishing.com/morningstar/HDPMMDGUA5CUHI254MRUHYEFWU.png)
/cloudfront-us-east-1.images.arcpublishing.com/morningstar/OMVK3XQEVFDRHGPHSQPIBDENQE.jpg)
:quality(80)/s3.amazonaws.com/arc-authors/morningstar/44f33af1-4d5c-42fb-934a-ba764f670bc6.jpg)