
Employment Data Starting to Look Worrisome
Slower overall employment growth, shrinking hours worked, and possible labor shortages could paint a relatively bleak picture.

We have had a relatively favorable view of the economy and tend to view the U.S. economic glass as half-full instead of half-empty. However, the combination of last week's slow employment report, this week's job openings report, and slowing in some of our favorite growth sectors (autos, airliners, and shale oil and gas production) is making even us a little worried. Some caution seems warranted. The softness may, however, merit lower rates for longer, which could cheer markets.
I was out last week and didn't have a chance to comment on last week's employment report for August. Although most economists agreed that the headline job gain of 151,000 looked a little soft versus expectations of 180,000 or so, it certainly was no disaster, especially for the accident-prone month of August. Most analysts focused on the fact that the number might be low enough to keep the Fed from raising rates. A few others noted that hourly wage growth year over year decreased from 2.7% to 2.4% between July and August, also potentially quelling potential Fed Fears.
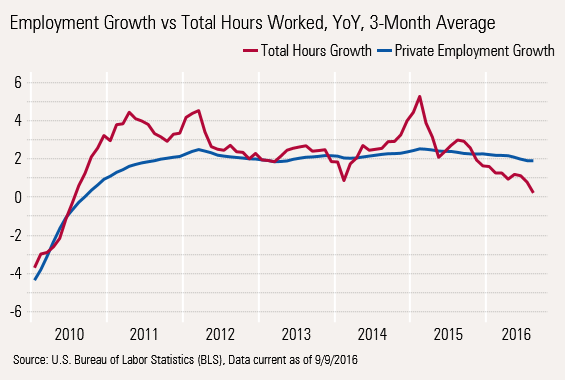
However, we think these analyses miss the real point, which is that combining slower overall employment growth with the shrinking hours worked paints a relatively bleak picture, if not quickly reversed. Employment growth has been relatively stable this recovery, averaging about 2.1% since 2011, while employers have adjusted weekly hours to smooth normal ups and downs caused by weather, strikes, and normal swings in the economy. Still, we have warned that employment growth had slowed some, with year-over-year averaged employment growth dropping from 2.3% last August to a more modest 1.9% this August. We noted that given slowing GDP growth, the drop wasn’t all that surprising.
Now, however, hours worked are outright declining, on a year-over-year basis. Combining declining average hours worked per worker with lower employment shows year-over-year growth of just 1.3%, which is the lowest level since mid-2010 when the current recovery was just beginning. Clearly, the economy has lost a little more momentum than we had previously believed. Yes, higher wages per hour and low inflation have helped soften this blow to consumers. But with energy inflation likely to boost headline inflation as early as September, consumers may come to share some of that pain.
Hours Falling Faster Than Employment
Job Openings at a Record High Level, but Slowing Growth Sounds Alarm Bells At first blush the job openings and labor turnover report looked quite positive. Openings set a new high of almost 6 million, quits remained at a relatively high level, and discharges and layoffs were near record lows. Only hiring seemed to be stuck in the mud, as shown below.
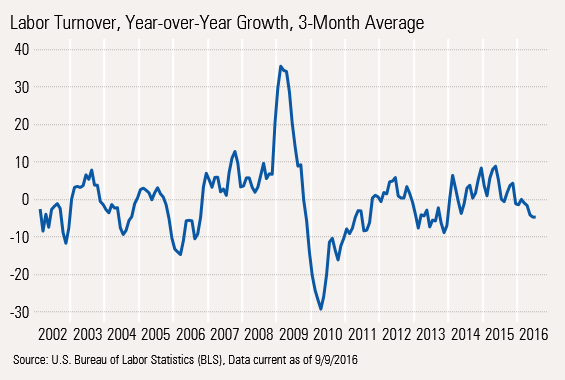
But the fact that the openings keep moving higher with little movement in hiring is not great news. It means for one reason or another that employers are not finding the workers they need. And without these workers, growth will be harder to come by. To compensate for their inability to find workers, businesses are clinging to workers for dear life as shown by layoff numbers that remain near recovery lows and below levels of the last recovery, when the number of employees was lower.
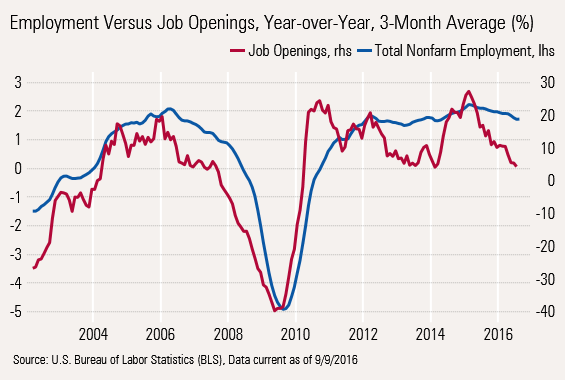
Discouraged businesses have also dramatically slowed the pace (not the level) of adding openings. While job openings were growing over 20% just over a year ago, opening growth has dropped to the mid-single digits and may even slip further.
Job openings growth is often generally an indicator of employment growth to come. Indeed, the peak in openings in early 2015 was relatively near to the peak in hiring growth. Opening growth is now at the lowest level of the recovery, which could indicate more problems ahead. The last big drop in openings growth had just a modest impact on employment growth (2013). This time we may not be so lucky.
Federal Budget Data a Little Better in August After several months of worsening budget data, August showed a deficit that was about the same as a year ago. Collections also looked a bit better in August, especially for individual tax collections. Monthly data is quite volatile so the table below focuses on year to date information, which comprises 11 months of the current fiscal year.
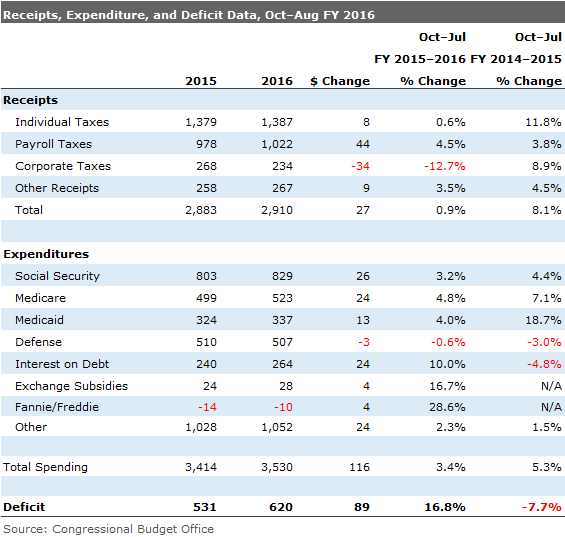
It is clear that revenue is the biggest cause of a higher deficit in 2016. Expense control looks better in 2016 compared with the growth rates in 2015 (3.4% versus 5.3%), but revenue growth has shrunk from 8.1% to just 0.9%. The net result is a bigger deficit this year after several consecutive years of improvement. The outlook for 2017 is for a slightly higher deficit, and the situation worsens considerably after 2020 or so because of higher healthcare costs, retiring baby boomers, and potentially higher interest rates.
/cloudfront-us-east-1.images.arcpublishing.com/morningstar/T5MECJUE65CADONYJ7GARN2A3E.jpeg)
/cloudfront-us-east-1.images.arcpublishing.com/morningstar/VUWQI723Q5E43P5QRTRHGLJ7TI.png)
/d10o6nnig0wrdw.cloudfront.net/04-22-2024/t_ffc6e675543a4913a5312be02f5c571a_name_file_960x540_1600_v4_.jpg)