
Calpine's a Cash Flow Machine
We don't think the market appreciates the steady cash generation and attractive yield.
/s3.amazonaws.com/arc-authors/morningstar/689ab3b8-4029-4d7c-9975-43e4305e927a.jpg)
Calpine is the largest natural gas power producer in the United States, with 3.0 gigawatts of simple-cycle combustion turbines, 6.7 GW of combined-cycle cogeneration, and 16.8 GW of combined-cycle gas turbines. Its fleet is located in three primary regions: East (38% of capacity), Texas (35%), and West (27%). It also owns 725 MW of geothermal generation in California and 4 MW of solar generation.
Calpine built most of its fleet in the early 2000s when gas prices were low. Leverage and industry overbuild led it into bankruptcy in 2005-08, but now its fleet is again benefiting from low gas prices and operating efficiency. A shift in power market fundamentals and Calpine’s debt reduction during the last decade leave the company well positioned to capitalize on this market cycle.
Differentiated Commodity Margin Forecasts Drive Our Valuation We think Calpine is worth $20 per share. Our 2016-18 forecasts incorporate Nymex and EOX Live natural gas and power forward curves as of early August. Our midcycle commodity margin forecasts drive most of Calpine's value.
We forecast Calpine’s East segment EBITDA to grow to $1.2 billion by 2018, up from $760 million in 2015, supported by spark spreads, increasing capacity revenue, and asset additions. The bulk of that growth is in the PJM Interconnection, which accounts for roughly 25% of Calpine’s total generation. Our midcycle PJM forecast incorporates two key viewpoints. First, we are bullish on spark spreads relative to current long-term forwards; second, we think spark spreads peaked in 2015 and will continue to fall through 2020 as 21.2 GW of planned new CCGT generation goes into service in the region. Our midcycle $19/megawatt-hour spark spread is 20% higher than the current forward 2019 spark spread but 22% lower than the calendar 2015 average spark spread.
In Texas, we think the forward curve is too bullish. We expect Calpine’s Texas EBITDA to peak in 2016 at $553 million based on current mark-to-market spark spreads, then level off near $500 million on a midcycle basis. We think electricity demand in Texas will continue to grow faster than the U.S. average, but we expect new low-cost natural gas generation and wind energy to flood the state. We think this combination will result in mostly stable spark spreads, approximately 23% lower than current forwards.
In the West, Calpine’s long-term tolling and offtake agreements support its margins and our EBITDA forecasts. We expect EBITDA to drop about 30% from 2016 to near $425 million on a midcycle basis. Although we expect these segment earnings to remain relatively steady because of the long-term nature of its contracts, they are likely to stabilize at a lower level in the next few years. Contract renewal risk in 2019-20 and California’s ever-changing energy policy damps our long-term view of Calpine’s generation portfolio in that state.
We use an 11% cost of equity and a 6.8% weighted average cost of capital in our discounted cash flow valuation. Our cost of equity assumption is higher than the 9% rate of return we expect investors to demand of a diversified equity portfolio based on Calpine’s greater cyclicality. A 2.25% long-term inflation outlook underpins our capital cost assumptions.
Our fair value estimate implies a $521/kilowatt valuation for Calpine’s natural gas and geothermal fleet. By region, we estimate an implied $750/kw value for its Eastern fleet, a $350/kw value for its Texas fleet, and a $325/kw value for its West fleet. Our fair value estimate has an implied capacity value that is approximately 40% lower than recent cost estimates for new CCGT units.
Recent deals suggest market values of $675/kw in the East, $250/kw in Texas, and $275/kw in the West. On a consolidated basis, we estimate the market value of Calpine’s fleet is $447/kw. Deal activity for comparable valuations in California has been sparse as the current unattractiveness of the region has had incumbent producers holding on to assets. Dynegy has been trying to sell its noncore California fleet for two years with little success.
We Expect Stable and Growing Cash Flow to Continue We have long believed the market underappreciates Calpine's steady, growing free cash flow profile. Even as free cash flow has more than doubled since 2011, Calpine's stock price is about where it was five years ago. Calpine's 16% free cash flow yield is its highest since emerging from bankruptcy in 2008.
Calpine’s Free Cash Flow and FCF Yield Since Emerging From Bankruptcy
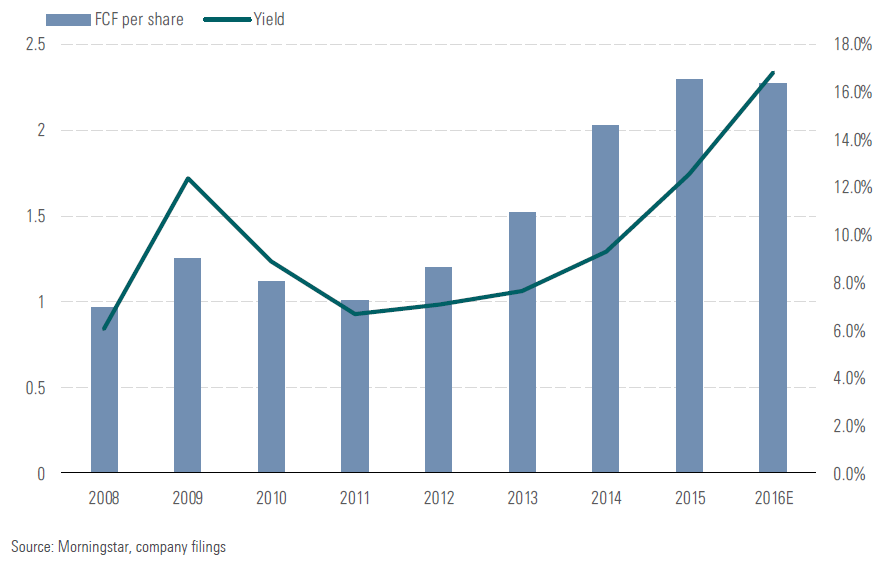
Calpine has delivered steady, growing free cash flow during periods of significant natural gas and power price volatility during the past five years. This demonstrates its distinct advantage over its independent power producer peers. Since 2008, natural gas prices have varied between $8.90/mmBtu and $2.42/mmBtu, yet Calpine has delivered 9% annualized free cash flow growth and 17% annualized free cash flow per share growth during that period. Management has bought back $2.8 billion of stock since 2011. Although we expect Calpine’s 2016 free cash flow to drop year over year as a result of low natural gas prices, a contango natural gas forward curve and Morningstar’s $3/mmBtu midcycle gas forecast support our 7% annual free cash flow growth forecast through 2020.
Calpine’s stable cash flows are a product of its low-cost generation fleet and favorable market conditions that are strengthening its competitive position. We think cash flows will remain relatively stable through our forecast period for several reasons.
Constructive capacity markets in the East will provide a cumulative $2.0 billion of contracted pretax cash flow through 2020. Texas commissioners once debated creating a capacity market, but political support and lack of a severe weather event tempered enthusiasm for a capacity market. We no longer believe a capacity market in Texas is likely; however, it could represent huge upside to our fair value estimate.
As California struggles to compensate quick-start generation as renewable energy grows, we think management wisely entered into long-term offtake and tolling agreements. These contracts typically have fuel pass-throughs and captive buyers, virtually eliminating Calpine’s commodity exposure and allowing the company to capitalize on its strongest attribute--operating efficiency. Many distribution utilities count on this contracted generation to maintain customer supply and grid reliability, so there is less risk associated with contract renewals.
For the next three years, management’s hedging will help minimize commodity margin volatility. Calpine’s hedged energy margin, capacity revenue, and long-term offtake and tolling agreements have locked in 92% of margin in 2016, 70% in 2017, and 54% in 2018.
Calpine’s natural gas fleet margins expand when gas prices go very low or very high, creating a profit margin diagram that looks like Johnny Depp’s cheery Willy Wonka smile. Calpine realizes the least benefit when gas prices are between $1.50/mmBtu and $2.50/mmBtu. Its efficiency advantage increases margins with the continued benefit from coal-to-gas switching. In PJM, coal generation sets a price floor that narrows margins in a low-price environment. If gas prices fall, the opposite is true. In PJM, the coal generation floor benefits from spark spread expansion as gas prices fall, with Texas, California, and New England experiencing weakness.
Calpine’s geothermal Geysers fleet produces baseload generation with a different dispatch profile than its fossil generation fleet. The Geysers’ revenue is tied to absolute power prices, not spark spreads. This gives the fleet a different economic profile than the gas fleet.
Management Returns Cash to Shareholders, Bolsters Balance Sheet Management has wisely used cash flow to pay down debt and buy back shares at what we view as attractive prices below our fair value estimate. Since 2011, management has returned $2.8 billion to shareholders through share buybacks, an average of $567 million annually. At Calpine's current share price, this is effectively a 12% dividend yield, well above the 3.5% current average utilities sector dividend yield. In our forecast, we estimate $400 million of annual stock buybacks.
Management has also taken steps to reduce debt, recently retiring the first tranche of $700 million in high-cost debt. We forecast management will pay down $1.2 billion of debt through 2020 using principal payments and additional debt retirement. This should lower consolidated leverage to 4.6 times, in line with management’s guidance of 4.5 times, and strengthen interest coverage to 3.6 times. Calpine’s parent debt covenants require a consolidated leverage ratio (net debt/EBITDA) below 7 and consolidated interest coverage (EBITDA/interest expense) above 1.5. We expect Calpine to remain comfortably within these metrics.
Management has wisely structured its balance sheet with long-dated maturities, leaving the company less exposed to near-term capital market volatility. Calpine’s next debt maturities--$636 million in 2019 and $839 million in 2020--are project-level debt. Its first corporate maturity is not until 2022. Our cash flow projections and Calpine’s improving credit profile give us confidence that management will be able to refinance this debt as it comes due.
Management has slowed its pace of portfolio rebalancing, and we don’t forecast any material divestures or acquisitions in the near term. We expect management will focus on share repurchases and debt reduction. If management does acquire assets, we are confident in its record of making smart capital-allocation decisions. Calpine most recently bought the Granite Ridge and Fore River plants in the Northeast at a discount to our $750/kw valuation for Calpine’s East assets. Calpine also recently exited the Southeast region, Wisconsin, South Carolina, and Colorado by selling assets at attractive valuations to regulated utilities in those areas. We were less enthusiastic about its Texas Bosque and Broad River acquisitions. Even though the prices the firm paid were below our implied $350/kw valuation and well below replacement cost, Texas power markets will need to appreciate significantly for these assets to prove value accretive. Calpine also recently acquired energy retailer Champion Energy, which we think was a good strategic move to gain a large customer base and a natural hedge to Calpine’s Texas and Northeast generation.
/cloudfront-us-east-1.images.arcpublishing.com/morningstar/PLMEDIM3Z5AF7FI5MVLOQXYPMM.jpg)
/cloudfront-us-east-1.images.arcpublishing.com/morningstar/I53I52PGOBAHLOFRMZXFRK5HDA.jpg)
/cloudfront-us-east-1.images.arcpublishing.com/morningstar/CEWZOFDBCVCIPJZDCUJLTQLFXA.jpg)
:quality(80)/s3.amazonaws.com/arc-authors/morningstar/689ab3b8-4029-4d7c-9975-43e4305e927a.jpg)