
Consumption Growth Holds Steady, but Consumer Tastes Shift
While consumer spending growth has been stable, underlying category shifts have been notable.

World markets seemed to have second thoughts about Brexit this week with bonds, stocks, and commodities all moving sharply higher, in some cases topping pre-Brexit levels. While real worries about the consequences persist, the potential benefits of lower interest rates for longer, steady if not accelerating U.S. growth rates, and few investment alternatives seemed to at least temporarily outweigh those risks.
The U.S. Treasury bond now yields just 1.46%, down from 1.8% just a few weeks ago and 2% at the beginning of the year. All of this seems to assure us that the U.S. Federal Reserve won't be doing much, especially in the short run, which is probably what really cheered markets, especially emerging markets. Emerging markets and European markets were both up about 6% this week.
News on both the European and U.S. manufacturing sector was excellent, while both China and Japan appeared to be struggling. Other U.S. data was mixed. Pending home sales suggested the May spike may have been a statistical mirage as the data in June returned quickly to earlier levels, indicating existing-home sales will be going nowhere fast. Auto sales data also surprised to the downside in June, with luxury cars leading the way.
Offsetting that gloom, GDP for the first quarter was revised modestly higher (from 0.8% to 1.1%), and consumption data through May looked strong and even suggested an acceleration in consumer spending and consumer confidence despite months of gloomy headlines. Early trade reports for May also suggest that trade will have a neutral effect on GDP in the second quarter, with neither non-oil-related imports nor exports changing very much.
The jury is still out on the Brexit impact. Weekly retail sales saw little effect from Brexit, but auto sales unexpectedly slumped at the end of June. Headlines from forecasters on Friday morning trumpeted potential 5% year-over-year growth in unit auto sales that turned out to be less than 2% and worse than that if adjusted for selling days. However, everyone seemed to enjoy the talk of continued low interest rates and tame commodity prices.
Consumption Growth Holds Steady Even as Consumer Tastes Shift Consumption and housing continue to drive U.S. economic growth with little net growth elsewhere in the economy. Consumption makes up about 70% of the U.S. economy while housing composes a smaller 4% of GDP. The consumption news, at least through May, was very reassuring. Recall that while consumption grew in the first quarter, the news wasn't nearly as good as it has been in recent quarters, as weather, auto sales, and utility usage hit the first quarter hard, as has been the case in first-quarter reports in other years. Consumption growth, after revisions earlier this week, was just 1.5% after averaging 2.7% over the previous four quarters, though not statistically different from the 1.8% consumption growth rate of first-quarter 2015.
However, growth looks destined to rebound sharply in the second quarter, to perhaps as high as 4%. That consumption growth rate for the full second quarter could be achieved even if there was no growth in consumption between May and June. A consumption growth rate of 4% translates into a 2.8% GDP growth rate for the second quarter with no help from the other categories. Our 3% second-quarter growth rate now doesn't seem as outlandish as it did just a few short weeks ago. All of this analysis is based on sequential quarter growth rates, annualized.
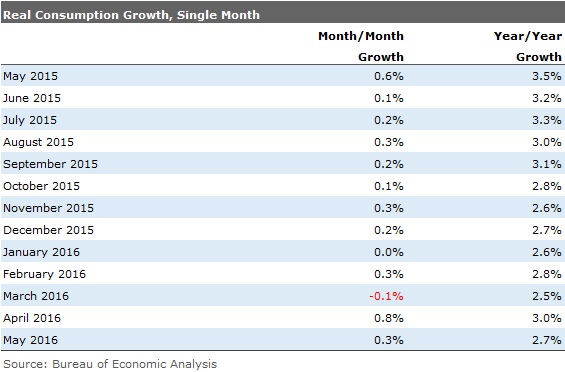
Turning to the details of the consumption report, month-to-month data increased an above-average 0.3% after inflation, despite the strong 0.8% growth experienced in April. Exceptionally good data usually reverses itself in the subsequent month. That didn't happen this time around. The growth rate matched the consensus forecast.
We prefer to look at the year-over-year data, which helps to avoid those pesky seasonal adjustment figures and puts the growth rates in a much more familiar context. It also removes a lot of the volatility. Month-to-month data has ranged from negative 0.1% to the 0.8% rate in April. As a very rough approximation, readers can multiply those monthly rates by 12 to see an annualized rate. However, the year-over-year numbers, which are less reliant on the endpoint month, have been much more stable and have generally been in the 2.5%-3% range, and sometimes just a bit higher, as shown below.
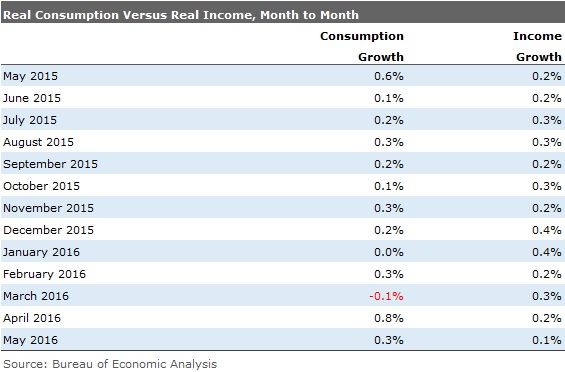
Consumption Driven by Wage and Income Growth, With a Delay After months of running behind, spending growth is now running above sequential, month-to-month income growth. Income growth slowed a bit because of slower employment growth in May, but consumers had obviously built up a lot of reserves. However, unless reversed, slower income growth suggests that consumption growth may slow from its recent torrid pace.
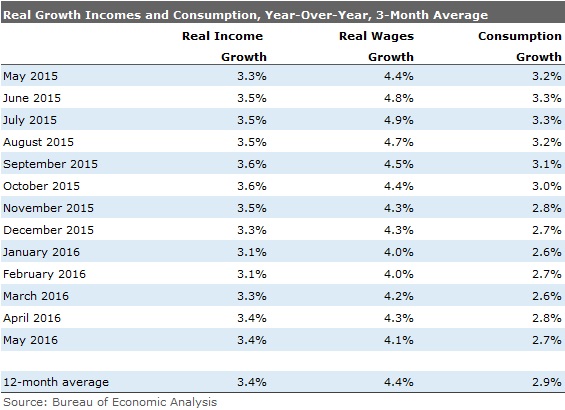
Although it is sometimes easier to spot trends in the month-to-month data, we still prefer to use the year-over-data and take that analysis one step further by averaging the results over three months. The data now looks far less volatile. It also shows that consumption growth has been far lower than income growth over the longer term, suggesting that the consumer has either more firepower for the future or a cushion in case the economy takes a turn for the worse.
While Consumer Spending Growth Has Been Stable, the Category Shifts Have Been Notable Ask most businesses that deal with consumers, and they'll tell you they see anything but stability. The spending shifts have been quite apparent in recent retail sales reports but are now even visible in the inflation-adjusted year-over-year data.
Motor vehicles and clothing were two categories showing good growth a year ago that have now fallen by the wayside. Year-over-year averaged motor vehicle spending has moved from 4.4% growth a year ago to a 1.1% shrinkage in the most recent three months as auto sales near a saturation point.
Clothing sales have dropped nearly as much, with growth falling from 4.6% to just 1.4%, driven partially by weather and partially by a shift away from big brand names. Although tiny overall, jewelry sales have also collapsed, moving from a 4.6% growth rate to shrinkage of 2.1%.
We believe that higher-end consumers who have bigger stock portfolios are hurting some and pulling back on spending in many categories. We noticed that higher-end homes are sitting on the market. We also note that luxury-brand auto growth has also turned into shrinkage. This just helps confirm the weakness in the higher-income sector.
Fortunately, there are some offsets to this seemingly bad news. As food prices have fallen, sales in grocery stores, one of the largest individual categories, move from a measly 0.4% to over 2%. Meat sales have gone from shrinkage to growth of 5% or more as prices have finally fallen. Recreational goods, largely electronics, have leaped from already-elevated levels to very high levels. Recreational goods that were growing at a stunning 8.7% last May moved even higher to 11.9% in the three most recent months. Games, toys, and hobbies also enjoyed high and accelerating growth rates. Spending on personal care services (haircuts and such) and items that may indicate improved employment, such as daycare spending, dry cleaning, and meals out, also showed decent and often accelerating growth.
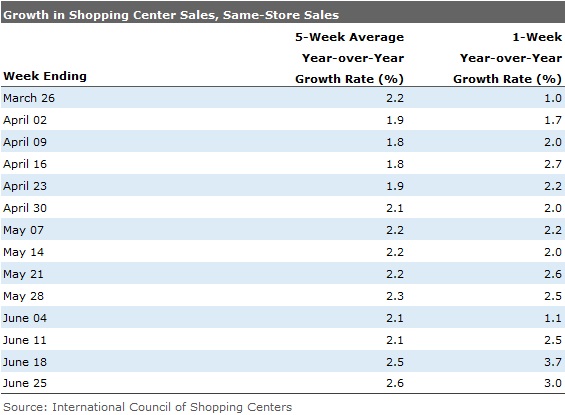
Brexit Doesn't Appear to Have Hurt Store Sales; Motor Vehicle Sales Another Story We haven't talked much about weekly retail data lately, but the trend appeared to move higher in June. After being stuck at 2.2% growth (five-week average), growth busted out in late June, with single-week growth rates over 3%. Even the week ended June 25, which included two full days post-Brexit, including one weekend day, showed growth of 3%. In any case, the data would seem to suggest that retail sales may have accelerated between May and June.
Auto Sales Slip at Month-End Auto sales growth has been running on fumes recently and may have hit the empty mark at the end of June. Most forecasting firms and auto trade rags have projected unit sales growth of well over 5% as recently as Friday morning. When the last car was counted after the closing bell, sales appeared to be up just over 2%. Adjusted for the extra selling date this year, the seasonally adjusted selling rate fell 2% from a year ago to 16.6 million units and 17.4% last month.
Some of the softness might be due to an abundance of sedans and a shortage of SUVs and crossover vehicles. Luxury brands had a particularly rough month with BMW down 11%, Acura down 27%, and Lexus down 1%. Audi did manage a 1% gain. Poor fleet sales, especially at
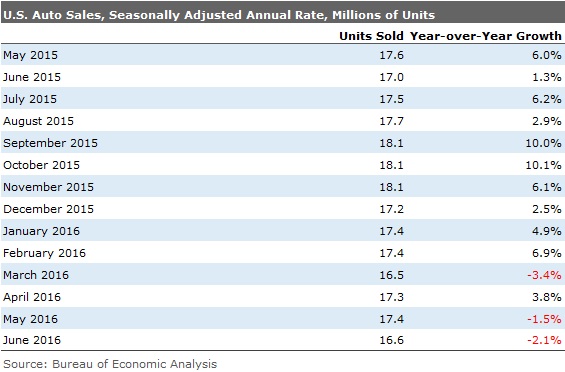
The June data was enough to almost pull up total second-quarter sales to the first-quarter level. That should be enough to keep auto sales from hurting GDP consumption and/or business investment data. Recall that both of those categories were hard-hit in the first quarter, limiting GDP growth. However, now sales growth year to date is up just 1.4% with the hardest comparison months still ahead of automakers in 2016. This has analysts worried that auto sales may not set a new record in 2016 after all. For now we still think 2% growth is possible, but it is admittedly now a stretch goal.
Manufacturing Looking Up in the West; Asia Not So Much Markit purchasing manager data indicated that China remains in contraction mode, at an accelerating rate, although the graph shows that Chinese data has bounced around these low levels for three years with no clear trend. The text that went with the Markit data read terribly, probably a bit worse than reality. (The worst fall in four months, 32 straight months of manufacturing employment declines, fewer new orders, and falling prices, again.) All of these numbers have been in such a narrow range for so long, we wouldn't necessarily read that much into the data. Still, China's manufacturing sector is going nowhere fast.
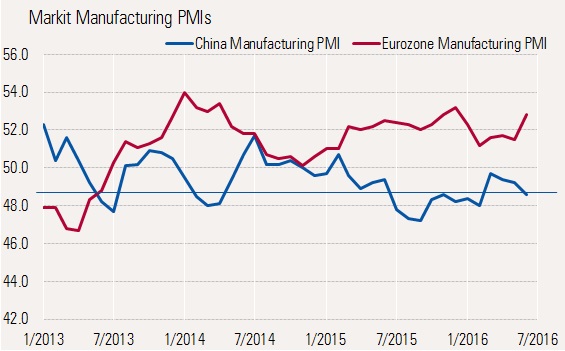
In contrast, the more negative the IMF and the World Bank get on Europe, the faster manufacturing continues to accelerate. The acceleration has not been a one-month wonder, either, with the readings well above 50 and trending up since February. Germany is leading the way, and only France is showing a reading below 50. Even the French number is being depressed by recent strikes more than poor demand. Exports are generally still trending up, though not uniformly through the region. Even job growth has been strong, with the largest improvement in 22 months. Unfortunately, the Brexit situation could mean that all my happy talk on the European economy is for naught. Still, with a lot of exports going outside the EU and internal consumer demand increasing, maybe pundits are overthinking this one.
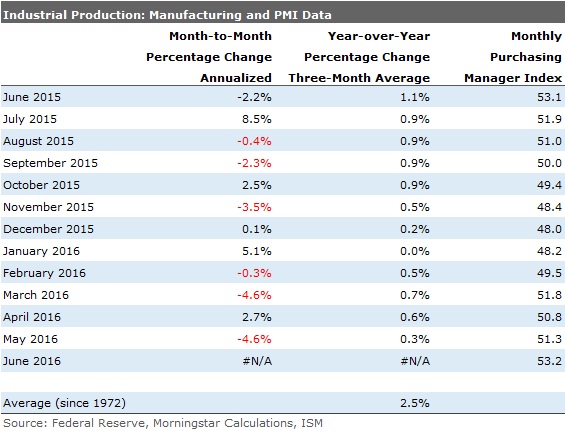
U.S. Data Also Looking Up Markit data on the U.S. manufacturing sector also showed improvement. However, the improvement was even more dramatic on our favored Institute for Supply Management Purchasing Manager Index. The index moved from 51.3 to 53.2 in June. The improvement appeared very broad-based by industry and by subcomponent. Twelve of 17 industries surveyed saw improvement in new orders. TIn addition, most subcategories were up, including employment, current production, and inventories. Industrial production has not shown much improvement thus far. Perhaps the normally helpful PMI data indicated that industrial production will be heading up in the next several months.
/cloudfront-us-east-1.images.arcpublishing.com/morningstar/54RIEB5NTVG73FNGCTH6TGQMWU.png)
/cloudfront-us-east-1.images.arcpublishing.com/morningstar/ZYJVMA34ANHZZDT5KOPPUVFLPE.png)
/cloudfront-us-east-1.images.arcpublishing.com/morningstar/MNPB4CP64NCNLA3MTELE3ISLRY.jpg)