Finding Your Sweet Spot Along the Dividend Spectrum
Dividend strategies can look and behave differently from one another depending on how they manage the trade-off between income and dividend growth.
It isn't hard to understand the appeal of dividend strategies. Couple historically low interest rates with increasing numbers of income-seeking retirees and it's no surprise that funds with dividend strategies have grown in popularity during the past decade. But income investors will encounter a varied landscape. At the end of January 2016, there were 469 such U.S.-listed strategies across the open-end, closed-end, and exchange-traded fund universes, with $745 billion in assets. These funds can look and behave differently from one another depending on how they manage the trade-off between current income and future dividend growth.
Dividend Growth vs. Dividend Income Firms that pay out a greater share of their earnings have less cash to reinvest in their businesses to fuel future growth. They are also more likely to cut their dividends than those with lower payout ratios because they have a smaller buffer should earnings fall. Plus, high yields can sometimes be a sign of underlying financial distress. Dividend-income portfolio managers can--and often do--take steps to limit risk by applying fundamental analysis or quantitative screens to filter out high-risk names.
In contrast, dividend-growth managers are willing to accept lower current yields in exchange for potentially higher payouts in the future and generally favor firms with durable competitive advantages, long dividend-growth histories, and strong profitability. In addition, they often target firms with healthy balance sheets that suggest they are capable of boosting dividends. One trade-off is that such quality firms tend to trade at higher price multiples than stocks with higher dividend yields. That is certainly the case currently with consumer-staples companies such as
To make these distinctions clearer, we sorted each dividend strategy into one of three equal-sized groups along the dividend income/growth spectrum: dividend income, dividend growth and income, and dividend growth. This score is based on the following portfolio-level metrics:
- Payout ratio (forward dividend yield/earnings yield).
- Dividend yield (based on expected payments over the next year).
- Return on invested capital (ROIC).
- Dividend growth of each fund during the past five years.
- Fund name (whether it is labeled as dividend growth).

Portfolio Comparison As expected, dividend-income funds had a much higher average (pre-expense) yield and payout ratio than the broad large-cap market and other two dividend groups. But their average dividend distributions slightly shrank during the trailing five years through December 2015, which could reflect the impact of dividend cuts or a shift to lower-yielding names. Consistent with this slight decline, they also invested in less-profitable firms and had less exposure to stocks with wide Morningstar Economic Moat Ratings, which signify a durable competitive advantage. Not surprisingly, income funds tended to exhibit a more pronounced value tilt than the other two groups.
There were differences in sector allocations as well. At the end of 2015, income-oriented funds had greater exposure to the utilities, real estate, and energy sectors than growth-oriented strategies, and less exposure to financial, technology, and healthcare stocks. These sector tilts aren't static. For instance, in December 2007, income funds had greater exposure to financial-services stocks than dividend-growth funds did, but this tilt reversed after the financial crisis when many stocks in this sector cut their dividends. But the managers in each group generally fish in the same pond over time.
Dividend-growth funds' average valuations and payout ratio were comparable to the corresponding figures for the broad large-cap market, and the group's dividend yield wasn't much higher. But this was the only group with a higher dividend-growth rate than
Performance Despite differences in their portfolios, we didn't find a huge difference in performance among the three groups from January 2006 through December 2015. During that time, the dividend-income strategy group outpaced the dividend-growth group by a small margin (49 basis points annualized), with comparable volatility. This result is interesting because large-value stocks underperformed during this period and income-oriented funds tended to have greater exposure to these stocks.

However, these long-term averages mask short-term variability in relative performance. The return gap between the income and dividend-growth funds was larger over shorter horizons. For example, the dividend-income group outpaced the dividend-growth group by 1.9 percentage points annualized from January 2006 through December 2011. But dividend-growth funds outperformed income funds by 1.8 percentage points from that point through December 2015. Dividend-growth funds also tended to hold up a little better during the bear market from October 2007 through February 2009, beating their income counterparts by 1.4 percentage points annualized. Overall, one approach isn't uniformly better than the other.
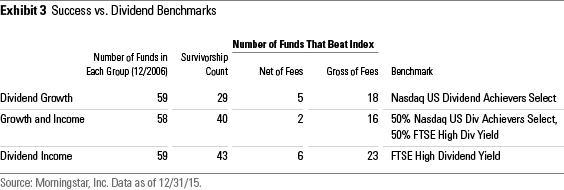
Very few funds in any of the groups beat corresponding market-cap-weighted dividend benchmarks. We used the Nasdaq US Dividend Achievers Select Index, which
Fees largely explain the low success rates among the surviving funds. Gross of fees, these success rates were considerably higher, as Exhibit 3 illustrates. It is difficult to select managers who can overcome their fees and improve performance through fundamental analysis. The funds that did outperform all had lower-than-average fees and tended to hold up better than most of their peers during market downturns. This suggests that strong risk management and reasonable fees are critical for success for dividend investors of all stripes.

Fund Selection To illustrate the importance of low fees, we divided each of the three U.S. dividend strategy groups into three fee subgroups from cheapest to most expensive. We then tracked the performance of each fee group, reconstituting the groups at the end of each year.
Among dividend-growth funds, the cheapest cohort outpaced the most expensive by 2.1 percentage points per year. The cheaper dividend-income and growth and income groups also prevailed over their more expensive counterparts. Here, the corresponding return spreads between the cheapest and most expensive cohorts were 114 and 60 basis points, respectively.
Investors may also improve their odds of success by sticking to strategies with a rigorous investment process, including disciplined risk management. In the dividend-income segment that often means avoiding managers who sacrifice sound business fundamentals for yield and those with large industry bets. Dividend-growth managers can get ahead of themselves, too, if they pay too much attention to growth expectations and not enough to valuations.
Investors can gauge risk by comparing a fund's performance against an appropriate benchmark during market downturns and by monitoring the valuations, profitability, and dividend payout ratios of its holdings.
For those who don't wish to select and monitor active managers, Vanguard Dividend Appreciation ETF and Vanguard High Dividend Yield ETF are good baseline U.S. dividend-growth and income strategies, respectively. These index funds both charge a low 0.09% expense ratio, consistently reflect their respective styles, and have been difficult to beat.

Disclosure: Morningstar, Inc.'s Investment Management division licenses indexes to financial institutions as the tracking indexes for investable products, such as exchange-traded funds, sponsored by the financial institution. The license fee for such use is paid by the sponsoring financial institution based mainly on the total assets of the investable product. Please click here for a list of investable products that track or have tracked a Morningstar index. Neither Morningstar, Inc. nor its investment management division markets, sells, or makes any representations regarding the advisability of investing in any investable product that tracks a Morningstar index.

/s3.amazonaws.com/arc-authors/morningstar/56fe790f-bc99-4dfe-ac84-e187d7f817af.jpg)
/cloudfront-us-east-1.images.arcpublishing.com/morningstar/T2LGZCEHBZBJJPPKHO7Y4EEKSM.png)
/d10o6nnig0wrdw.cloudfront.net/04-18-2024/t_34ccafe52c7c46979f1073e515ef92d4_name_file_960x540_1600_v4_.jpg)
/d10o6nnig0wrdw.cloudfront.net/04-09-2024/t_e87d9a06e6904d6f97765a0784117913_name_file_960x540_1600_v4_.jpg)
:quality(80)/s3.amazonaws.com/arc-authors/morningstar/56fe790f-bc99-4dfe-ac84-e187d7f817af.jpg)