
Consumers Bring a Bright Spot to the Economy
This week's retail sales report suggests consumers are not in retreat, as some feared after May's dismal employment data.

Retail sales was one of the week’s most positive and reassuring economic reports. Headline retail sales were up 0.5% April to May. Year-over-year data, inflation-adjusted, excluding autos and gasoline, remains stuck at a 4.3% growth rate. That came as a great relief after the labor report of a couple of weeks ago suggested the economy might be stalling. Subsequent data suggests that isn't the case. We talked about the Job Openings and Labor Turnover Survey report and its modestly positive tone last week. This week it was the National Federation of Independent Business report on small businesses, especially the labor-related sections, that suggested that it was incredibly hard to find new workers.
Still, the poor official labor report was enough to deter the U.S. Federal Reserve from a rate hike at its June meeting held this week. Bond markets cheered the fact that rates might stay lower for longer. However, equity markets seemed more concerned about the economic forecast that was tied to the release. That document reduced the U.S. GDP forecast to 2% for each year through 2018. The drop was just a few tenths of a point here and there, but it was enough to scare the market. Despite the Fed's labor and economic worries, this week's housing data continued to suggest a stable economy, although the shift to single-family homes from apartments continues apace.
Service inflation again continued to creep up, this time to 2.3% year over year, according the report on consumer prices. However, falling food prices kept headline inflation at 1% or so, low enough to stop the grousing over the Fed keeping rates steady. The pattern of inflation data from a year ago is likely to keep the headline inflation number close to 1% through August. Then, as higher energy price increases kick in, inflation could be pushed up quickly to over 2% by December.
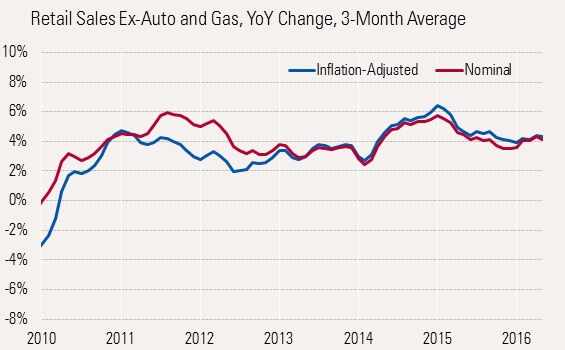
Consumers Continue to Spend After the dismal May employment report (which is compiled based on mid-May data), there were some fears that consumers would retreat in May. That doesn't appear to be the case. Headline retail sales increased 0.5% between April and May, well ahead of the 0.3% consensus forecast. Even excluding autos and gasoline, month-to-month sales grew 0.3%. However, we prefer to use the year-over-year data, averaged over three months, which removes most weather-related blips and tricky seasonal adjustment factors. On that basis, sales increased 4.1%, about at its 12-month average. Even after our normal inflation adjustment for goods (actually deflation this time), sales would have increased an even better 4.3%.
Sales growth has bounced around between 2% and 4% most of this recovery. Sales growth hit the low end of that range in the winter of 2013 and 2014, as consumers found it difficult to even get to a store during that stormy period. That gave an artificial boost to the early 2015 data with an unsustainable 6% growth rate, as a more normal winter was compared against a harsh winter. Then 2016 brought weather problems of another nature: weather too warm to sell normal winter goods. Though not nearly as depressive as the winter of 2013-14, the warm winter of 2015-16 also weighed on some of the year-over-year data sets. That lengthy account explains some of the hills and valleys of our retail sales chart below.
Sector Data Has Some Interesting Tales to Tell Warm weather caused consumers to start their spring home-related projects early this year. Building materials were unusually strong starting in December, but have looked weaker the past couple of months. Building materials sales were down 1.8% and 1.2% in May and April, respectively. Year over year, building materials continues to be one of the stronger categories.
General merchandise stores, especially department stores, continue to do poorly at the hands of online retailers, with general merchandise sales down 0.3%, even as nonstore retailers grew and impressive 1.3%. The pressure from online retailers has been relentless. Poor furniture sales are a bit of a mystery as sales were down in May despite some decent housing data. Even year-over-year data is showing little growth for the furniture category. We suspect a major warehouse fire that temporarily slowed one of Chicago's largest furniture retailers may be partly to blame. Or maybe the housing data isn't quite as it appears. Only time and a few more data points will tell the true story.
Vehicle sales had a good but not great month in May. We suspected as auto sales approached old highs, sales growth would slow from its leader-of-the-pack status in 2015. Unfortunately, more motor vehicle-related slowing may be in store, especially for late 2016.
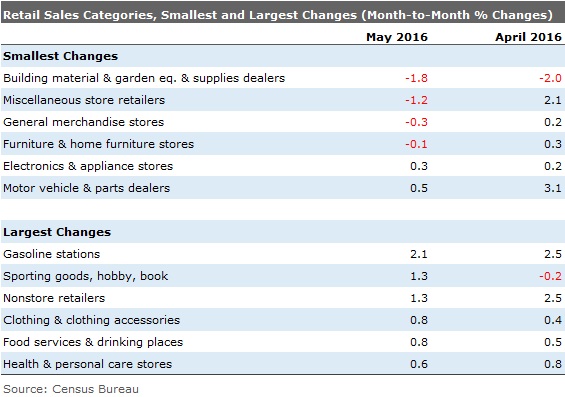
A lot of the more discretionary categories did well in May. Abnormal weather had hit several categories hard but are now bouncing back nicely. Weather issues hit sporting goods, apparel, and restaurants, which are now among the leaders this spring. That's why we never panic over one month's worth of data.
Headline Inflation Remains Subdued as Services Inflation Worsens The Fed got another pass from the May inflation data, as lower food prices and continued low energy prices kept year-over-year headline inflation to about 1%. Inflation had a quick pop early in the year when some of the energy benefits began to burn off and services inflation, especially rents, began to pop. However, low energy prices--especially compared with last year--and falling food and goods prices have restrained headline inflation in recent months. Still, headline inflation, on a moving-average basis, has moved from negative 0.1% to 1%, as shown below.
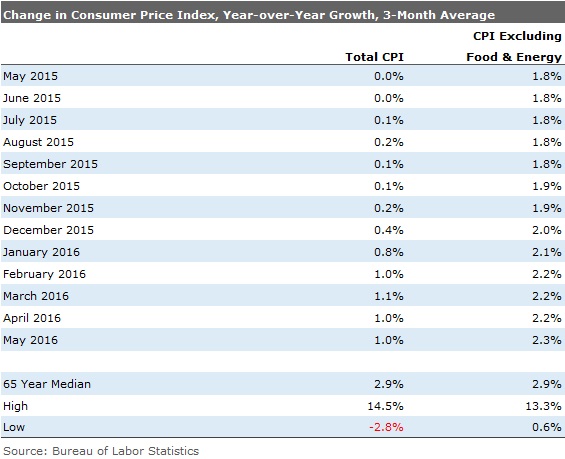
Core inflation, excluding food and energy, has picked up, too. That core rate is now up 2.3% on a year-over-year three-month moving-average basis. Though the Fed prefers to use another measure and not the CPI report, this core inflation rate is higher than its 2% target.
We are not so sure why we are hearing less about this, but I assume it is because the headline inflation rate remains so low, and consumers aren't exactly panicking about that just yet. In fact, with food and goods prices headed down, the consumer, especially in the lower-income quartile or two, is still feeling quite good. Inflation expectations are now lower than in recent history. Because of the pattern of energy price increases last year, we would guess that headline inflation will stay at 1.1% or below, by our measures, through August if core inflation remains at current levels. However, inflation rates of more than 2% by December will be very hard to avoid unless energy prices swoon again. Then the Fed will have to act.
Services Could Continue to Push Core Inflation Higher Services is the largest component of the Consumer Price Index calculation, even when excluding energy-related services such as electricity and natural gas. The trend here is clear, with strong acceleration in recent months to over 3.1%, as shown below.
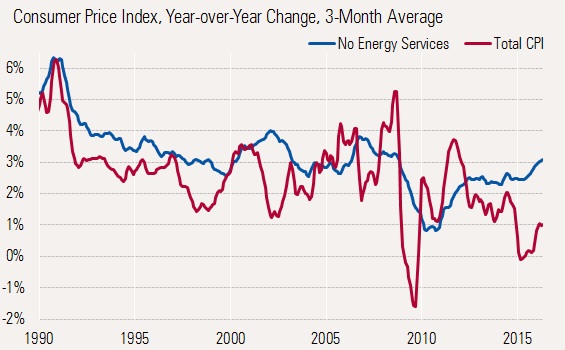
The graph distinctly shows that services, though less volatile than the CPI itself, are still beginning to exert a strong upward tug on headline inflation. At the moment, rents and healthcare are two key segments that are moving up the services category. There was some hope that completion of new apartment units would begin to pressure rent increases. Apparently those new units did not come in time to save the May inflation report, as rents increased 0.4% (almost 5% annualized) between April and May. Even year-over-year rents were up 3.8%.
Physician services were also up big, increasing 1% in May and 3.5% year over year. Hopefully, the large increase was just a quick catch-up blip from some unusually low numbers earlier this year. While these two big categories get all the attention, many other services are up, likely because wages are going higher. Restaurant prices are up 2.7% year over year, health and auto insurance up 6%, cable TV up 3%, and vet services 3.8%.
Food Price Declines Keep a Lid on Inflation Food prices are volatile and can often hurt consumers' ability to buy other discretionary goods and support the economy. Although over the long run, food prices average out to the core inflation rate, they can inflict considerable harm from time to time. Food prices sprinted higher in 2011, driven by Chinese demand and synchronized world crop failures. This, along with other commodity inflation, drove headline inflation sharply higher, nearly moving the economy into a recession in 2011. Continued droughts kept food prices high, especially grains. Those high grain prices pressured chicken, pork, and beef in subsequent years (long life cycles). However, the past year or two has been much better on the drought front, sharply reducing grain prices and encouraging ranchers to again build up their herds. Beef prices are now down over 5% year over year, although levels are still elevated.
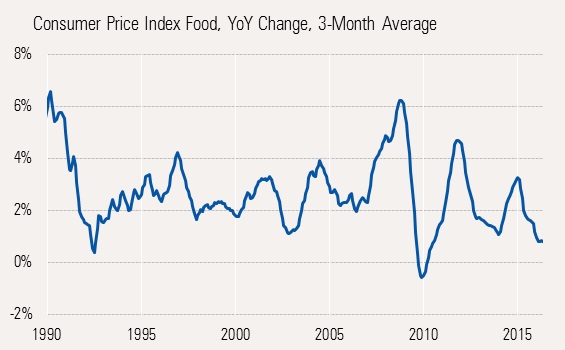
May showed that food-at-home prices were down 0.5% and 0.7% year over year. That in turn is helping headline inflation and could continue to provide more relief in the months ahead. That is, if we don’t experience a crop failure.
Housing Market Changing for the Better Housing has been a key driver of this economy, regularly adding 0.3%-0.5% to annual GDP growth. New home construction is the largest contributor to this growth (remodeling and brokerage commissions are the other two contributors). Housing starts and permits data suggest the housing market is still doing well.
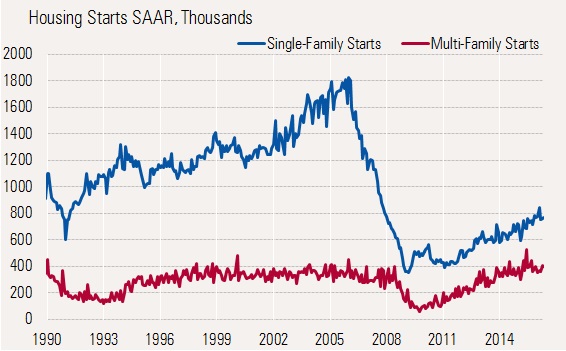
However, the changing of the guard continues as single-family homes continue their tortoise-versus-hare struggle with apartment builders. Demographics and income pressures forced many new households into apartments instead of single-family homes. It's a good thing that apartment builders were able to fill the need. However, apartments aren't nearly as beneficial to the economy as single-family homes. Although units sales of homes and apartments are within a factor of two, construction dollar-wise the contribution isn't even close.
This week's starts and permits data continued to show attractive growth in single-family home activity even as apartment building fades. The top table shows single-family growth rates relatively stable around 10% and apartment building growth continues to slow dramatically from relatively elevated rates.
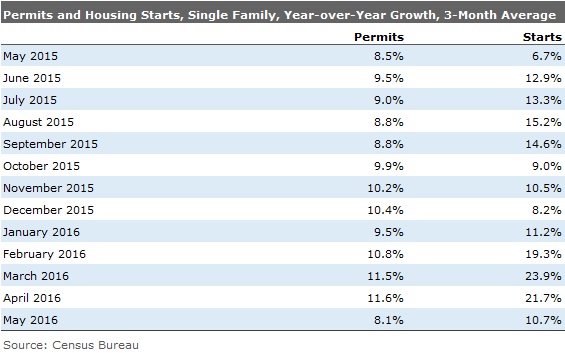
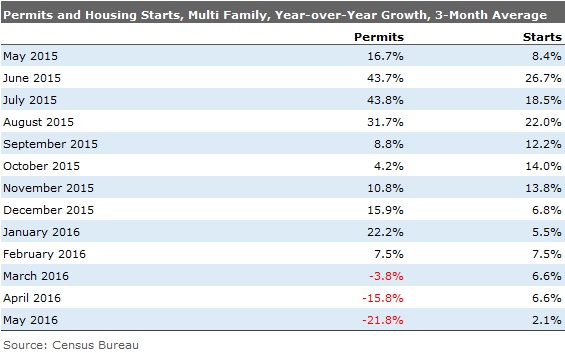
Permit growth, which generally precedes housing starts and actual construction, suggests the worst may not be over just yet for the apartment market. We think the single-family and multifamily market combined will continue to do well and contribute to GDP growth in 2016. Long-pent-up demand suggests more growth in 2017, if high prices and higher interest rates don't put an end to the housing rally. Builders themselves appear to be relatively optimistic this week as a key builder sentiment index increased from 58 in May to 60 in June. The index was also up from 56 a year ago, suggesting that the housing market is holding up just fine.
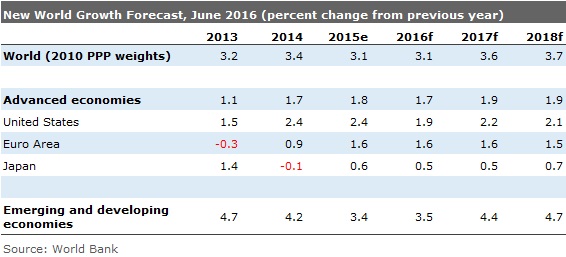
World Economic Data Softens The World Bank released yet another revision to its world growth rate forecast. After growing close to 6% in 2007 and then suffering a major recession, the world economy has never quite recovered to previous growth rates. Though there was a year or two of strong growth immediately following the recession, growth has seemed to be stuck in the mid-3% range for most of the past five years.
Every year the major forecasting groups put out new forecasts in January suggesting that better growth, but not great growth, is just around the corner. This year was no different. There were hopes that growth in 2016 would increase from its recovery low of 3.1% in 2015 to 3.6% in 2016. However, the new June forecast has brought that rate back down to 3.1%, the same as last year.
Both advanced economies and developing markets suffered growth cuts. Reductions in emerging markets and developed-market economies were nearly the same at 0.6% and 0.5%, respectively, for 2016. The biggest cuts were saved for more commodity-oriented economies that generally saw cuts of more than 1%. Those same commodity cuts also weighed on the U.S. growth rate, which was arguably too high to start with.
One other odd item from the report was that China was one of the very few countries not to suffer a reduced forecast for 2016 (they are still forecasting 6.3% for 2016). With China often blamed for slowing world growth, it seems a bit strange to keep that forecast the same, at a relatively aggressive pace.
/cloudfront-us-east-1.images.arcpublishing.com/morningstar/T5MECJUE65CADONYJ7GARN2A3E.jpeg)
/cloudfront-us-east-1.images.arcpublishing.com/morningstar/VUWQI723Q5E43P5QRTRHGLJ7TI.png)
/d10o6nnig0wrdw.cloudfront.net/04-22-2024/t_ffc6e675543a4913a5312be02f5c571a_name_file_960x540_1600_v4_.jpg)