
Know Your Target-Date Fund
What lies beneath matters more than generic labels.
/s3.amazonaws.com/arc-authors/morningstar/0c1d596a-78d2-477f-acfc-a1ff33479805.jpg)
Morningstar's annual report on target-date funds, released earlier this year, highlighted our team's best practices in evaluating target-date series. The process behind building a target-date series remains one of the most crucial considerations for investors. The target-date market uses certain broad characteristics--such as whether a series uses index-based investments--and this Fund Spy reveals the issues and shortcomings of some of those conventions. Our research ultimately highlights the importance of knowing what is held within a target-date fund, as well as the process used to get there.
Don't Be Fooled: No Target-Date Fund Has a Passive Approach Some investors may start their target-date selection process by deciding between "active" and "passive" strategies. However, regardless of whether a series uses passively managed underlying strategies, all target-date managers make multiple active decisions in designing an asset-allocation glide path.
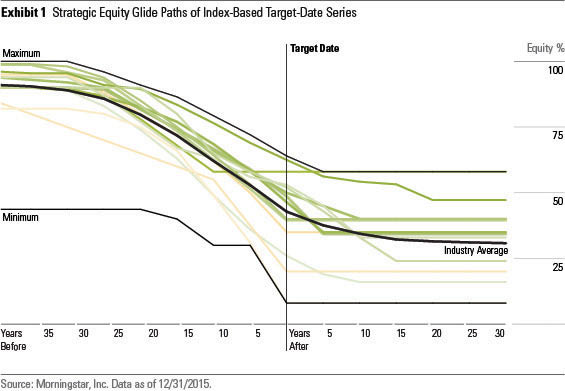
A passive approach to target-date investing does not exist. Exhibit 1's comparison of the strategic equity glide paths of target-date series that invest predominantly in index-based underlying strategies illustrates the point. It reveals significant differences in the glide paths of the 14 target-date series that held no more than 20% of assets in actively managed underlying strategies as of Dec. 31, 2015.
While a few series may appear similar for the youngest of investors, the divergences grow as investors approach and pass their targeted retirement dates. In fact, within the postretirement phase, two index-based series represent the extreme ends of equity exposure out of all target-date mutual funds. The Great-West SecureFoundation Lifetime series holds a 58% equity stake throughout retirement, whereas the John Hancock Retirement Choices series maintains a scant 8% position.
-
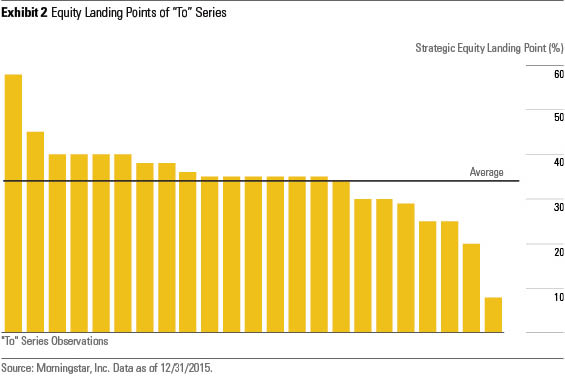
"To" versus "Through" Only Scratches the Surface The "to" versus "through" distinction may mistakenly lead investors to believe that strategies within these respective camps are similar. Target-date series within these two distinctions are far from homogenous, though, and an examination of strategic equity glide paths captures the differences. Twenty-three of the 60 target-date mutual fund series available as of year-end 2015 hit their most conservative stance at the target date, earning a spot in the "to" camp. However, the landing point--a series' lowest equity allocation--for these series may vary substantially. Exhibit 2 displays the 34% average equity landing point for a "to" series. More than half of series stay within 5 percentage points of the average, but several series veer considerably from the average. The difference in these equity allocations will result in dramatically different results.
The landing points of the 37 "through" target-date series can also vary widely in their equity allocations, and when those series reach their landing points may also differ. Exhibit 3 illustrates the dispersion in "through" series' landing points and the average landing point within each segment. The most common landing point for "through" series occurs 15 years after the target date; 70% of "through" series reach their landing point within 15 years of the target date. The average equity position at the landing point for "through" series is 29%, but it ranges from 15% to 51%.

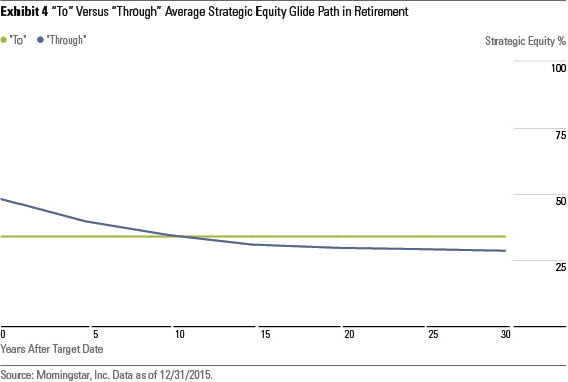
The two camps have nearly the same equity exposure when averaging the strategic equity positions from the target date until 30 years after. "Through" series average a 34.5% equity position in retirement, whereas "to" series come in slightly lower at 34.1%. Exhibit 4 shows that "through" series generally begin retirement with more in equities than "to" series--48% versus 34% on average. However, the typical "through" series has less exposure beginning roughly a decade later and continues thereafter.
Where Does Your Target-Date Fund Stand Out? Instead of relying on broad characteristics such as passive versus active or "to" versus "through," investors should attempt to identify outliers to help illuminate series' potential risk exposures. Investors should be aware of whether a series has a relatively hefty stake in any particular subasset class, or whether a series omits certain subasset classes altogether, because those positions may provide insight into the approach and help set performance expectations.
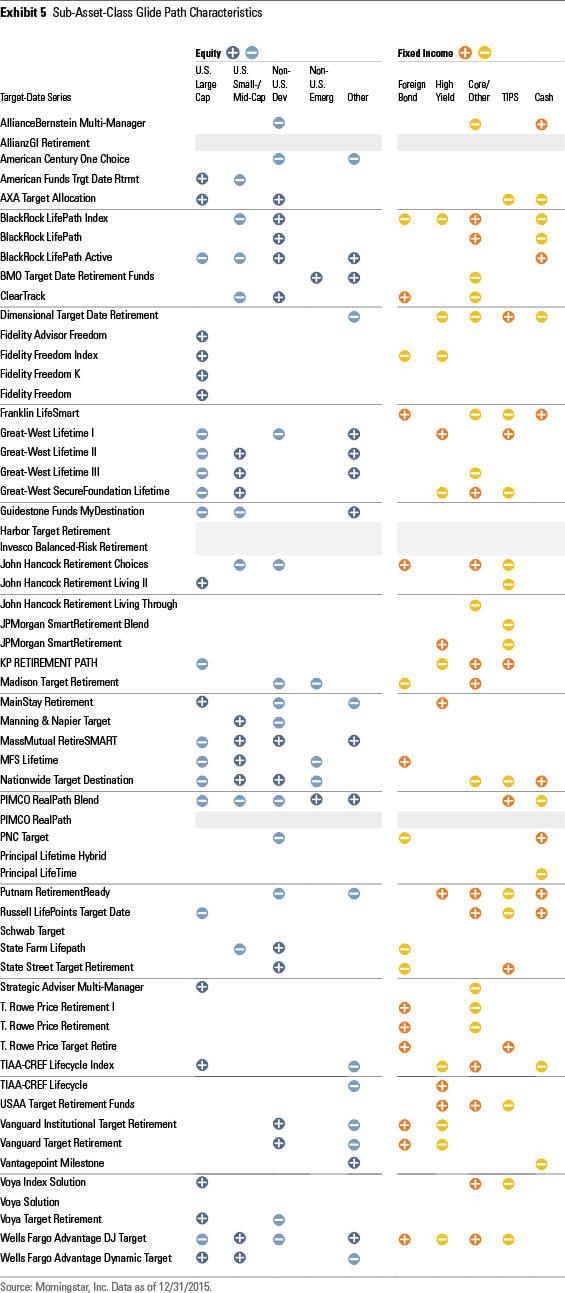
Using thresholds that generally correspond to the top and bottom quartile allocations among target-date funds for each subasset class, we identify series that stand out from their peers in a meaningful way. If a series' average sub-asset-class position is overweight or underweight the category average by a given threshold, it receives a plus or a minus, respectively. The analysis averages the 50-year segment of the glide path that ranges from the 2055 fund to the 2005 fund. Exhibit 5 identifies outliers across the 10 sub-asset classes for all 60 series. Knowing these characteristics helps put target-date series' performance in the proper context--an important consideration in determining a target-date series' investment merits.
/cloudfront-us-east-1.images.arcpublishing.com/morningstar/ZKOY2ZAHLJVJJMCLXHIVFME56M.jpg)
/cloudfront-us-east-1.images.arcpublishing.com/morningstar/IGTBIPRO7NEEVJCDNBPNUYEKEY.png)
/cloudfront-us-east-1.images.arcpublishing.com/morningstar/HDPMMDGUA5CUHI254MRUHYEFWU.png)
:quality(80)/s3.amazonaws.com/arc-authors/morningstar/0c1d596a-78d2-477f-acfc-a1ff33479805.jpg)