Will Higher Rates Halt the Housing Recovery?
Housing-related growth may be more sensitive to interest rates than we had previously believed.
The economic news this week was uniformly positive, as many sectors of the economy appeared to come out of their winter doldrums. Pending sales of existing homes, new home sales, and even laggards durable goods orders and exports joined an already-long list of indicators that turned positive for April. Some of the headlines were stunning, perhaps even too good to be true, with new home sales up an unexpected 16% in a single month.
The year-over-year data in most reports was healthy, but not nearly as electrifying as the monthly data. So, just as we cautioned readers not to panic in February when things looked terrible, we now worry that some might become too optimistic. The potential of higher interest rates and demographics is likely to limit GDP growth to the low end of our normal 2.0%-2.5% range for the full year, with a temporary bounce to closer to 3% for the second quarter. The stronger economic news helped keep equity and commodity markets going strong, while bonds were little changed, despite the better economic news.
Current Housing Boomlet: Driven by Low Rates? This week we spend most of our column on the housing industry, which has showed new signs of life. However, a review of the past six years of the recovery shows that even seemingly minor changes in mortgage rates have had major impacts on the housing sector, which in turn influences the GDP calculations. The effects work in both directions with just a few months of delay. Interest rates that have fallen sharply since January are likely driving the current boomlet in housing data. With Fed rate hikes back on the table, we are more than a bit worried about the housing industry, which seems as wed to cheap money as stock and bond markets.
New Home Sales Surge in April, Even as Core Growth Stabilizes Headlines trumpeted a housing resurgence as new home sales surged 16.6% between March and April. Single-month, year-over-year data jumped 24%, pulling up our three-month moving average to 12.7%. Data for the previous months of the quarter were revised higher, too.
New home sales made a new recovery high in grand fashion, reaching its highest level since 2007 and its highest monthly percentage gain in decades. Particularly impressive was the large gain in homes sold that have not yet begun the construction stage, which grew faster than sales of homes under construction and much faster than new homes already completed.
Homes sold so early in the process will benefit production-oriented economic data in the months ahead. Activity at the high end of the market heated up, as it appears that high-end buyers who cut back on purchases early in 2016 returned to the market as equity indexes and economic data stabilized after a few rough winter months. The renewed interest of the high-end buyer can be seen in an uptick in the growth rate in the average price of a new home in the table below.
The surge in new home sales bodes well for GDP growth in the next quarter and potentially beyond that. Accelerating new home sales growth will help offset what appears to be a weakening market for apartments and stabilizing existing-home sales, two other key components of the retail sales equation.
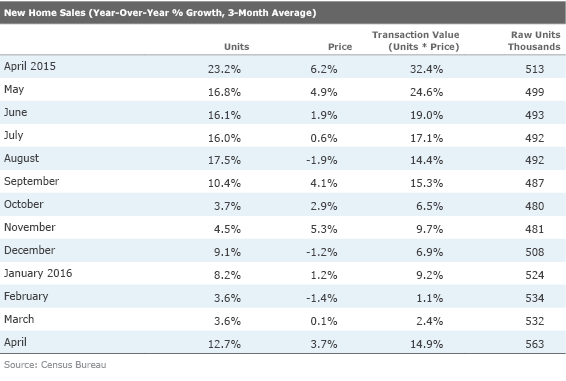
Rolling 12-Month Averages Suggest a 10% Core Growth Rate for New Home Sales As good as the new home sales data was, we offer some caveats, too. This is not necessarily the start of a new boom. This data is highly volatile and subject to substantial revision. We continue struggling to find the best way to analyze real estate data. Month-to-month data is of little use because of the volatility and seasonality issues. Our normal year-over-year, three-month averaging methodology helps some, but even that breaks down when weather is good one year and bad the following year. The year-over-year data for 2015 shown above looks unusually strong because it is compared against the horrible winter of 2014 (not shown). Then it appears that growth slowed early in winter 2016, but that's only compared with the artificially strong data of 2015.
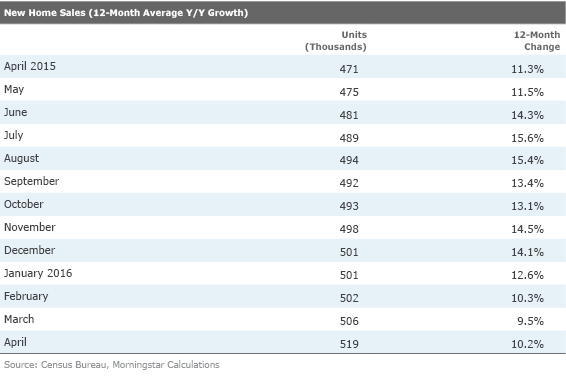
One solution to avoid these wide weather-related swing factors is to use a longer averaging period, perhaps a year instead of just three months. Using a longer period captures the fact that good winter weather and an early start to the construction season improves winter-month results and hurts the spring data. Longer averaging periods could capture both the good and the bad.
Even though this won't wash out all of the weather effects, a core rate of growth of about 10% appears in the data. We wouldn't advise using this methodology to pick short-term swings in activity, but it does a much better job of identifying core growth rates (though it still doesn't entirely remove the sharp impact of the winter slump of 2014).
One other point worth mentioning is that the current April increase in new home sales might be due to the recent slump in mortgage rates. Some of the housing data, when viewed at a higher level, seems to indicate that housing-related growth is more sensitive to interest rates than we had previously believed. That same relationship is also seen in pending and existing-home sales. (A fuller discussion of rates and housing activity appears later in this report.)
Strong Monthly Pending Home Sales Data Bodes Well for Short-Term Existing-Home Sales Existing-home sales are another key portion of the residential investment landscape. Selling a home might seem like a mere transfer of assets. However, it does benefit GDP directly via broker commissions. With commission rates running from 5% to 8% of the sale price or more, broker commissions still comprise 22% of residential investment (versus 46% for structures and 32% for remodels).
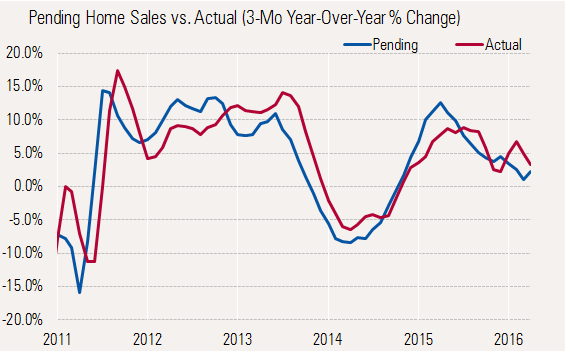
Pending home sales are the precursor to existing-home sales with a lag of 45-90 days. The close and leading nature of pending home sales compared with fully closed sales (an existing-home sale) is shown below.
Pending home sales showed a strong bounce in April. The monthly pending sales index reached its highest level since 2007, growing at a strong 5% month-to-month growth rate and matching the 5% year-over-year growth rate. (Existing-home sales are generally half as volatile as new home sales on a percentage growth basis.)
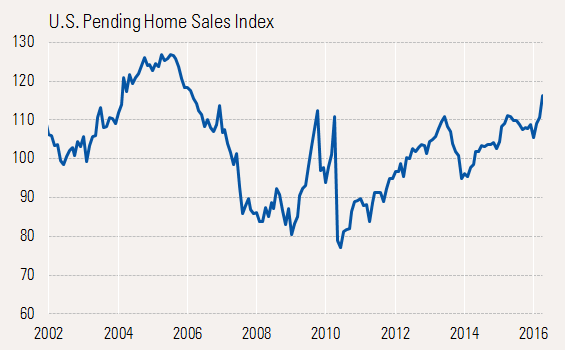
The good news is that strong pending homes in April should also help benefit GDP calculations again in the second quarter and maybe even the third quarter.
Higher Interest Rates Could Doom the Housing Recovery The sharp uptick in both pending and new home sales for April could have many causes. However, yet another downtick in mortgage rates appears to be the most reasonable explanation to us.
Following a significant change in mortgage rates, pending home sales change just a few months later. We have plotted year-over-year pending home sales against mortgage rates below. We have inverted the interest rate scale so the lines move in the same direction (higher rates mean lower sales). The relationship is quick and unbelievably strong, even with relatively small changes. A change in direction appears more important than the magnitude of the change. Also, ever lower rates have diminishing benefits, as there appears to be a natural limit to growth.
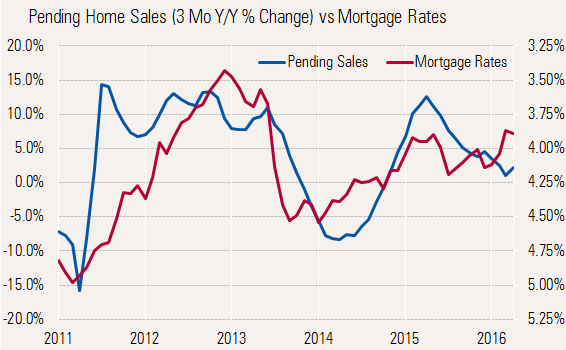
Following the recession, housing got a quick bounce in 2009 and early 2010, based on the start of the recovery and first-time homebuyer credits. As those credits expired and mortgage rates began to rise, pending home sales fell again by double-digit rates from the middle of 2010 to the middle of 2011. It wasn't until rates started dropping in 2011 that housing pulled out of its slump. Rates continued down and housing sales remained great until 2013. Then higher rates (about a 1% hike), engendered by the Taper Tantrum, dropped sales growth back into negative territory in very short order. Pending home sales growth didn't bottom until rates started going down in early 2014. Then as rates stopped going down and moved only modestly higher in 2015, growth came to an abrupt halt. We are currently witnessing a resurgence in sales as rates have generally fallen since the beginning of 2016.
It appears that even seemingly small changes in rates have a large effect on sales (it shows up in new home sales and even remodeling levels, too). Seeing this tight relationship worries us some. Services inflation seems to be calling for more total inflation and higher interest rates. A lot of folks suggest that a 1% move in rates over the next year is a real possibility. Based on the graph above, an increase of that magnitude would pose a very serious risk for the housing recovery and perhaps the whole economic recovery.
Manufacturing Not Going Anywhere Fast Like almost all the statistics this week, durable goods orders looked unusually good and perhaps unsustainable at first blush. New orders were up an amazing 3.4% month to month, led by a rebound in the volatile transportation sector. Excluding transportation, orders were up a still relatively positive 0.4%.
Only three of seven categories registered losses, which compares with six of seven categories showing shrinkage in January. Machinery sales remain particularly problematic as this includes agricultural machinery, oil field equipment and construction equipment, all industries hurting around the world. On the other end of the scale, computers and electronics have been doing better, even before adjusting for lower average prices.
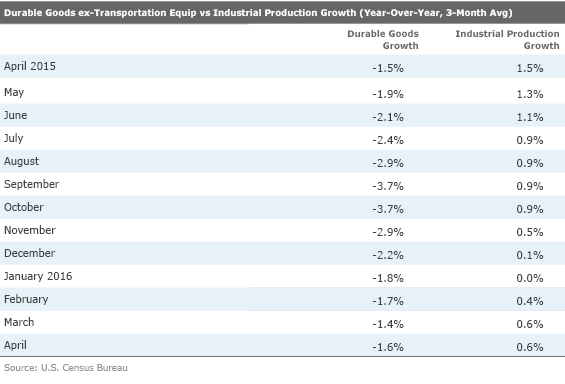
Durable goods orders have a good track record of providing early signals of changing levels of activity in overall industrial production-manufacturing (which accounts for 12% or so of GDP). The rates of decline in durable goods hit their worst levels in September and October. Industrial production hit its lowest growth rate three months later, in January.
Unfortunately, year-over-year new-order growth hasn't changed materially since December, suggesting the current improvement in industrial production may come to a standstill in the months ahead. (Note: durable goods orders are not deflation adjusted. Industrial production is, which partially explains the difference in signs.) Still, the data doesn't suggest a worsening, either. And perhaps housing growth can provide some impetus to the manufacturing sector.
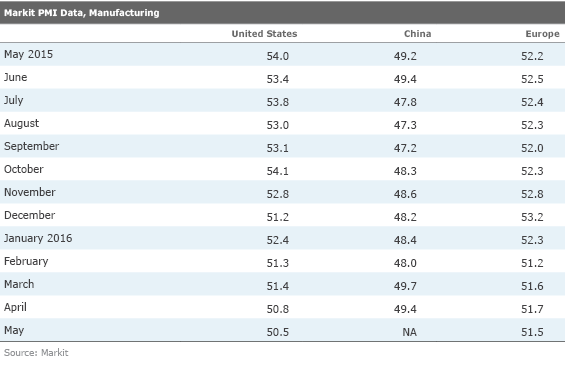
World PMIs Losing Their Predictive Value Industrial production and new orders have shown some signs of life over the past few months, but you couldn't tell it by the purchasing manager reports that continue to slump. While we take more stock in the orders and industrials reports than the Markit PMI reports, for a sense completeness we are providing the data. These metrics have seemingly turned into coincident or even lagging indicators of the manufacturing sector. These seem to be becoming more sentiment-like indicators than data based on hard numbers. One telling contra-indicator to the headline PMI data is that the employment section of the U.S. and European (and Japan, too) PMI reports suggest that employers are increasing their hiring. It seems as if everyone was so fearful, the first thing they might do is put a brake on hiring.
GDP Revision Doesn't Change Much; Maintaining Our 2.0%-2.5% 2016 Estimate The GDP growth rate for the first quarter was revised up from its first estimate of 0.5% to a slightly better 0.8%. Since the primary changes were some known revisions in the housing sector and a smaller inventory and net export changes, the market didn't get very excited about the revision. The data still shows that consumers and housing remained the key drivers of the recovery. Though the rate of growth appears low, first-quarter seasonality and weather issues have often made this the weakest quarter of the year. Based on recent strong economic data, a rebound to 3% in the second quarter is a possibility. Still, we believe the slow start to the year and demographic pressures will limit growth to the low end of our 2.0%-2.5% GDP growth range for all of 2016.
Initial Trade Report: Good for the U.S., Bad News for the Rest of the World Without inflation adjustments or data on the services sector, this early report on trade isn't terribly helpful. The report did show a smaller trade deficit for the first quarter that was reflected in the GDP revision. The April deficit also grew by a lot less than anticipated as exports increased 2.4% and imports a smaller 1.8%. Most forecast services are now predicting that net exports will provide a positive contribution to GDP in the second quarter following three quarters of subtractions from the GDP. The tentative rebound in exports and imports was welcome news following some steep March declines. However, the imports category jumped mainly because of capital goods (think Germany and Japan), while consumer goods, which fell precipitously in March, failed to rebound much at all in April. Poor results at retailers apparently mean continued pressure on inventories and new orders, which will also weigh on imports and hurt some trading partners. News on apparel sales, most of which involve imports, has been particularly bleak.
Stay Tuned Next Week for Our Employment Preview Video By Thursday of next week we hope to post our weekly employment preview video. After averaging 224,000 jobs added per month over the past year, expectations are for another relatively disappointing month with the consensus estimate of just 158,000 jobs added in May, about the same as April. Continued waves in the retail sector and some higher profile layoffs have everyone on edge. The employment market is still adjusting to lower GDP growth rates, too. We continue to predict a few soft reports rather than one big adjustment that brings GDP growth and employment growth in a single month. Worries about labor shortages will likely keep a lid on layoffs.
The auto sector, a key factor in this entire recovery, has been showing some signs of severe aging in reports earlier this year. Recent data has been better, but not booming. Data on May's sales might shed some light on the prospects for the months ahead. However, a low business day divisor (this year is two days short of last year's count), may inflate the seasonally adjusted annual rate number.


/cloudfront-us-east-1.images.arcpublishing.com/morningstar/F2S5UYTO5JG4FOO3S7LPAAIGO4.jpg)
/cloudfront-us-east-1.images.arcpublishing.com/morningstar/7TFN7NDQ5ZHI3PCISRCSC75K5U.png)
/cloudfront-us-east-1.images.arcpublishing.com/morningstar/QFQHXAHS7NCLFPIIBXZZZWXMXA.jpg)